Showing posts with label Selling Prices. Show all posts

4/02/2024

Long Beach Residential Market for February 2024

Long Beach February sales information

 For the Long Beach single family market, the months supply of inventory remains low, under 2 months.  On a rolling basis over the last 12 months, closed sales are down 18+%, and both the median and average sales prices are up as much as 2.5%.

New SFR listings are down over 18%, and the average sales price, on a 12 month basis, rose to $1,038,606

It's a similar story for condos, with the average sales price over a 12 month period rising to $578,267.  However, condos also have a somewhat higher months of inventory at 2.7 months, an increase of 42% compared to February of 2023.  Condo are also receiving a somewhat lower amount from original list price than single family houses, at -1.5%.  Which is not a huge difference from SFRs which are  down only .5% from original list price.  Still, there seems to be a somewhat greater demand for houses than condominiums in Long Beach.

Compare to all of Los Angeles County over the last 90 days where sales are down by 11%, and the total months of inventory is 8 months, an increase of 13%, compared to Long Beach at under 2 months. The current average sales price for the County as of January 24th is $1,024,684, a level that has remained stable over the last 12 months.


Los Angeles County SFR Market for the last 90 days


 If you are considering a sale of your home or condo, I am happy to provide an estimated selling price based on price within your immediate area. Please call, email or text me.  And, go to my website to search properties to find out what's going on in your market.

Julia Huntsman, REALTOR, Broker | http://www.abodes.realestate | 562-896-2609 | California Lic. #01188996

3/05/2024

January 2024 Market Report for Long Beach and Los Angeles County

LA County and Long Beach Housing Data, Jan. 2024
 Sales growth for Long Beach in January was down by 5%, while the median price climbed upward another 8% to $886,000.

Median price for all of Los Angles County was $925,000, also an increase by 8%.

Look at other cities: Similar median price but far fewer sales, such as Hawthorne, West Covina,, Claremont and San Dimas. 

 So one of the things this chart shows is that Long Beach is more active than other cities: housing variety, larger city, range of prices.

Sales over list price: in Long Beach in January, 49% of sales were over list price, for Los Angeles County it was 39% of sales were over list price.

(This is an interactive chart, display is a screenshot only.  I would be happy to forward the link upon request, it covers all counties and most cities in California.)

NOTE:  The graph at the right shows average home price for Long Beach for February 2024 was $1,086,764, and increase of  11.1%; the median home price in February was $925,000, an increase of 5.7% (compare to January median price of $886,000).

Julia Huntsman, REALTOR, Broker | http://www.abodes.realestate | 562-896-2609 | California Lic. #01188996

2/12/2024

Bay Area vs Kansas City Price Comparison

San Francisco and Kansas City home market prices!
This graphic is at the end of 2023, showing median sales prices as of the 4th quarter in the Bay Area vs Kansas City.

If anyone is thinking of relocating to Kansas City or any other area, just get in touch!


Julia Huntsman, REALTOR, Broker | http://www.abodes.realestate | 562-896-2609 | California Lic. #01188996
12/06/2023

Long Beach November 2023 Residential Market for Condos and Houses


 The November average sales price for a single family home continued up from November 2022 (on a monthly basis), as did the median price, by over 12%! However, the overall average decreased slightly compared to the same time last year.

Condo prices went up on both a monthly comparison and for the over all year compared to one year ago.

New listings for SFRs were down compared to November of last year, showing the inventory crunch (a pattern found in just about all markets); but for condos new listings were up, but pending sales and closed sales were down from one year ago.  And for both types of sales, the number of days on market are longer.

 The good news is that the 30-year interest rate has recently decreased, which makes a difference on the buyer's prospective monthly payment! So we hope to see more of this in 2024.

 For an estimated value of your property whether it's one, two, three or four units, please contact me. I can help you plan before you take any actual steps.

Julia Huntsman, REALTOR, Broker | http://www.abodes.realestate | 562-896-2609 | California Lic. #01188996

6/19/2023

Housing Affordability for California Buyers, Up or Down?


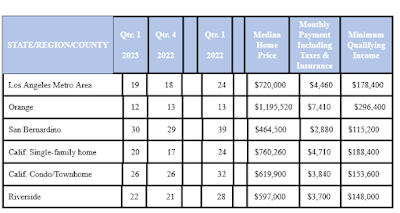
Housing affordability brightened somewhat in the 1st Quarter of 2023 since interest rates have dipped, see several areas below for comparisons.  The first three columns are the percentage of homebuyers who could buy the median priced home*:

Affordabilityfor homes chart prices California
Regional/State Chart for home prices in California

*Above chart from CALIFORNIA ASSOCIATION OF REALTORS® Traditional Housing Affordability Index First quarter 2023

 These figures exist for all counties, but four major areas are selected above, plus statewide figures for single family home and condos.

As has been widely stated, inventory is down, therefore total sales volume is down, 2023 units are projected to reach 279,000 units, down from the 342,000 units sold in 2022. Will home prices decrease as predicted (in blue print)? The public will have to stay tuned on both prices and interest rates:

"C.A.R. also announced it has revised its 2023 Housing Market Forecast and projects existing single-family home sales to reach 279,900 units in 2023, a decline of 18.2 percent from the 342,000 units sold in 2022. While home prices in general are expected to improve in the second half of the year, the California median home price is projected to decrease 5.6 percent to $776,600 in 2023, down from the annual median price of $822,300 recorded in 2022. The updated projection on the statewide median price, however, is an increase from the estimate of $758,600 forecast last October. C.A.R. also projects the 30-year fixed mortgage interest rate to average 6.3 percent for the year.

Julia Huntsman, REALTOR, Broker | http://www.juliahuntsman.com | 562-896-2609 | California Lic. #01188996

4/18/2023

Changes in the Single Family Home Long Beach Market in 2023

December 2021, April, 2022 and December 2022

Long Beach Market Graphic 2021-2022 - Single Family


Long Beach Market March 2023 - Single Family

Buyers and sellers alike felt the shift in interest rates in the summer of 2022 -- buyers were driven out of their desired price range into a lower priced market which was more competitive, and some buyers were discouraged altogether by qualification issues.

In comparing the 2021-2022 graph for December 2021, April 2022 (just before rates started to climb) and December 2022, certain things stand out.  The number of closed sales decreased by 46%, and the number of listings, already low for available buyers, dropped even lower by 17%.  By December 2022, the median sales price dropped over 7% to $839,000 and the average sales price dropped to $894,176, a decrease of over 12%. Pending sales dropped over 53% compared to the previous December. The months supply of inventory showed an increase by December, but still quite low by historical standards, but in actual numbers of homes for sale, the inventory increased 40% by December, 2022.  Note that April's median and average sales prices were over $1,000,000  before dropping to December's level. 

However, by March, 2023 the median and averages sales prices have increased to $899,000 and $982,386, but not up to the high in April 2022, while months supply has increased to 1.6 month -- higher than 2022 figures. Days on market has also increased to 33 days in March - a far cry from the 7-day average frenzy during the Pandemic with its super-low interest rates. Pending sales in March 2023 also increased from December 2022, a sign of more buyers in the market.

It's a time for seller's to be realistic on prices, even though there is a continuing demand for inventory, and competitive bids. While qualified buyers are able to buy in the higher priced market, they expect value for their money.

For a qualified Realtor's estimate of home value, please contact me.  I've been serving sellers since 1994 in residential property in the Long Beach and surrounding areas.

Julia Huntsman, REALTOR, Broker | http://www.juliahuntsman.com | 562-896-2609 | California Lic. #01188996

11/23/2022

Thanksgiving Update for Local Long Beach Area Market

Horn of Plenty Happy Thanksgiving

We're constantly reading about the shortage of housing units, in California and nationwide, and its effect in creating rising prices (still), yet the actual activity in many areas shows constantly decreasing prices and longer times on the market, because at the same time many buyers struggle with the higher interest rates.

And then there's this:

The number of homes on the market has grown amid the collapse in demand, but in emailed comments, Lawrence Yun, chief economist for the National Association of Realtors, said new listings are lower compared to the same period one year ago and that housing inventory overall remains near “historic lows.”  Forbes.com article.

In the midst of buyers who struggle with obtaining loan approval at higher interest rates, there are also those buyers who are exceptionally well qualified, and can buy well over the list price of the house they make an offer on, and also know that in the current market sellers may be feeling the pressure of selling, so they bid low, sometimes very low, well under market value. The property with very recent upgrades, i.e., new kitchen or new bath, is likely to fare pretty well, but still much depends on location, floor plan, and size factors. Out of 37 closings in the last 3 days in Bellflower, Long Beach, Lakewood, Cypress and Signal Hill, and Los Alamitos, 12 sold over last list price, but not necessarily with the huge overbids of 2021. 

Long Beach zip code median single family prices for October:

90806   $705,000  Please see my Wrigley listing

90803   $1,477,000

90808   $895,000

90815   $983,000

90805   $628,000

90807   $1,020,000

So while these prices may still look healthy, all these areas are down from the peaks in April and May of 2022, when the median SFR price in April for all of Long Beach was $1,040,000, compared to October when the median SFR price for the city fell to $850,000.  (Average prices produce a different number in some cases, but the median price is not dragged up or down by an outlier price they way an average price may be.)  Both buyers and sellers have  been caught off guard by the volatile, and literally overnight, changes in interest rates, up as high as 7.2%, and then recently returning to the high 6%'s.  There are various projections about future rates, discussed in California Association of Realtors annual market prediction.  The future is hard to predict, and buyers and sellers should act promptly -- buyers who want to wait 6 months out to buy are chancing what could be a very different environment, and this is true in any market.

For an evaluation of your property please contact me for more area market information.

And, oh yes, Happy Thanksgiving!


Julia Huntsman, REALTOR, Broker | http://www.juliahuntsman.com | 562-896-2609 | California Lic. #01188996

3/30/2022

Long Beach Residential Unit Market

Did you know ...?

There continues to be a demand for Long Beach residential rental housing, and rents are at a premium.

The average sold price for a 4 unit property in 2021 was $1,321,209, which is up from an average price of $1,165,367 in 2020.*

Spanish style Belmont Shore units
Belmont Shore units

The average sold price for a 2-3 unit property in 2021 was $987,857, up from an average price of $883,062 in 2020.*

Currently, the average list price in Long Beach for 2-3 unit properties is $1,094,045, and for 4 unit properties the average list price is  $1,336,468.  Actual rents for  a 2 bedroom/1
bath may average about $2150/month, with proforma rents being a little higher depending on the size and area location, i.e., downtown, North Long Beach, Belmont Shore.* 

The last 90 days of average sale price of a 2-3 unit property, citywide, is $1,153,356 -- 24 of 59 properties sold over list price.  The average sale price for a 4-unit property is $1,375,283 -- 4 of 18 properties in the same time period sold over list price. 


Unit sold prices in Long Beach

To see active listings for duplexes, triplexes and 4-unit properties in Long Beach, please go to this search  which may be revised to include other types of properties, and other cities.

For an online (or in person) valuation of your income property, just contact me.

 *Information from CRMLS.                    

Julia Huntsman, REALTOR, Broker | http://www.juliahuntsman.com | 562-896-2609 | California Lic. #01188996

3/29/2022

Long Beach Condominium Market--More Affordable for Many Buyers


Currently there are 62 active condo listings in across Long Beach, with the overall average price being $562,469 per MLS data.  This is a lower number than the 90 current house listings, however, SFR average price for the entire city of Long Beach is $1,226,196, significantly higher than the condo average.  While condo prices range from $1,500,000 down to $270,000, the median and average prices are well below $600,000.  

555 Maine Ave

There are currently 131 condos in escrow with an average of 29 days on market, while there are 100 single family homes in escrow with similar days on market, and of course at a much higher average price than the condominiums.  

Condominiums are located throughout almost all areas of Long Beach and provide an avenue to homeownership in a neighborhood which may otherwise be totally unaffordable to the buyer. Older HOAs may not offer enough parking for all owners because the building requirements before the 1980s were different, but later developments were required to offer a parking space per the number of bedrooms in a unit.  And, older developments were most commonly built with community laundry rooms, while later ones offer inside laundries and central air and heat.  Many older buildings, however, feature more interior square footage and seem more spacious. Condominiums may have more rules to meet for lender approval on a buyer loan, because the lender looks not only at the unit, but also at the common area maintenance and condition, so buyers searching for a condo home should keep this in mind.  Rules and regulations of HOAs are part of the buyer's new homeownership--living in a condo is a certain way of living that is different than a single family home, but in today's market, especially, it offers ownership opportunity.

Long Beach also has some lower priced stock cooperatives and own-your-own properties which appear to be condos but are not, which are also affordable buyer opportunities, but do have some different mortgage requirements. If you find such a property on the market and want to find out more, please contact me.  To find condos on the market in Long Beach, go to my condo search .

If you're a seller thinking of making a change and you want to put your condo on the market, please contact me for important information about selling your condo. I have 25 plus years of experience and have sold numerous condominium units.


Julia Huntsman, REALTOR, Broker | www.juliahuntsman.com | 562-896-2609 | California Lic. #01188996

2/16/2022

Los Angeles County Housing Market for January 2022

  • Single family house median price is up 13.6% since January 2021. 
  • For 24 months there has been less than 4 months of housing supply, for the last year there's been less than 2 months supply, currently 1.2 months supply. 
  • January 2021 there were 7,862 houses, currently 5,215 houses on market (active listings). 
  • Days on market last January: 28 -- days on market; January 2022: 29 -- one day longer. (47 days in Jan. 2019).
  • Average percent of original list price received this January was 102.7% (2.7% over list price).
  • Number of showings per listing this January was 5.9-- last January it was 6.5 showings per listing. 
  • Of 3,139 SFR sales in Los Angeles County this January, 17% were all cash.
  • Only 2% of the 3,139 sales were contingent upon buyer's sale of a home.
  • Median list SFR price was $860,000--median closed price was $895,000 for this January.
  • Buyers see on average of 10.1 houses before going into contract, but the median is 2 showings.
  •  (Data as taken from CRMLS)


  •  Julia Huntsman, REALTOR, Broker | www.juliahuntsman.com | 562-896-2609 | California Lic. #01188996

12/15/2021

December Housing Prices in the Local Long Beach Area

First, the inventory for single family homes and condominiums remains low, but now it's "extremely" low.

Long Beach November stats-2021
 In November, the inventory for houses decreased  33% compared to one year ago, 181 homes for sale compared to 272 one year ago; inventory for condos in Long Beach decreased 51% from the prior year, from 276 to 134.  The average sales price for a house in Long Beach was $951,203, and the average price for a condo was $552,356.  Compared to November 2020, prices increased 9% for SFRs, and 17% for condos.  And, it's also obvious that listings do not spend much time on the market before selling. And, over the last 12 months, in spite of decreasing inventory, the sales volume in both categories is up.  (Information data per CRMLS as of December 5th, 2021.)

 Currently, as of December 15th, in Long Beach there are 182 houses and condos listed actively or "coming soon" for sale in the MLS, with 75 of those being condos, or 41% of the current listings in Long Beach are condos--the lowest price condo is a studio listed at $205,000 featuring 343 sq.ft, the highest price condo is $2.699 million (11 Temple Ave) featuring 4300 sq. ft, so a huge price range, but the graph indicates more the condo price norm in Long Beach.  

Overall, the market is still reflecting the price surge that took place after the start of the pandemic, both locallly and nationally.  Nationally, 2021 is the best sales year since 2006.  The conventional and FHA loans amounts have been (or with FHA, will be soon) increased to meet the higher prices in the West.  If you want to sell, where can you move to?  The southern states and cities of Tucson, and Dallas area are two cities that are predicted to be active in the 2022 market, and other  regions in the southern half of the country. The national price increase may rise about 5%, and interest rate hikes may occur 1 or 2 times, per National Association of Realtors. 

If you would like information on where you can fit into the current market, please contact me, and remember you can always search for listed properties on my website listed below.


Julia Huntsman, REALTOR, Broker | www.juliahuntsman.com | 562-896-2609 | California Lic. #01188996

11/04/2021

There's More to Buying and Selling Than the Click of a Button on Spreadsheets: Zillow

Front door
The real estate industry news has lately had quite a few stories about Zillow's "pause" in buying homes.  As the days went by, the "pause" was just another word for Zillow's decision to stop buying homes--why? because it made too many bad decisions about pricing, the market, and a third reason, what I consider to be its faulty reliance on its own automated valuation tool.  Zillow only recently became a real estate brokerage (in 2021) after many years of being a third party data aggregator, showing listings online in the way many companies did by obtaining permission from the various MLS's across the country, and by then offering advertising of these listings to the Realtors who listed them in the first place (for a price of course)  so that prospective buyers and sellers would have another portal by which to find listings and possibly a future agent.  You've probably heard of "Zestimates", their early automated valuation tool which was typically inaccurate, for various reasons.  One of the major reasons was that, as a non-broker, Zillow was not using the full information gained by subscribers to the Realtor MLS, but drawing from the "bare bones" information of the public property tax records.  Value of a property can be in the subjective eyes of the beholder, aside from the schooled requirements and standards used in the professional appraisal industry, and this intuitive factor was quite elusive to Zillow's valuation tools.  

And it continued along this same path after becoming a licensed brokerage (something it used to claim would never happen) and Zillow proceeded to buy, buy, and buy more properties with the intention of "buy, fix and sell".  Until in recent weeks it hit the "pause" button, and now its leadership says:

“We’ve determined the unpredictability in forecasting home prices far exceeds what we anticipated, and continuing to scale Zillow Offers would result in too much earnings and balance-sheet volatility,” CEO Rich Barton said in a statement.

Barton said that Zillow will instead focus on “creating an integrated and digital real estate transaction that solves the pain points of buyers and sellers while serving a wider audience.” (Quote from Realtor Magazine, Nov. 3, 2021, their sources from “Zillow Stock Dives After Analyst Highlights Two-Thirds of Homes Bought Are Underwater,” MarketWatch (Nov. 1, 2021); “Zillow Quits iBuying, Will Lay Off 25% of Staff,” The Real Deal (Nov. 2, 2021) and “Zillow Quits Home-Flipping Business, Cites Inability to Forecast Prices,” The Wall Street Journal (Nov. 2, 2021) [Log-in required.])

Ultimately, I think that the reference to "the pain points of buyers and sellers" is an acknowledgement that the purchase and sale of homes is indeed a human process, one that is full of an unfolding series of steps connected to what can be quite emotional associations and psychological
factors whether one is acquiring a home, or leaving it after many years.  

Make no mistake, automated valuation tools are widely used, not just by Zillow, and have been for a number of years.  But some can be much more accurate, especially when used in conjunction with market knowledge that comes from experience, "feet on the ground", and solid professional knowledge connected to working people.

Julia Huntsman, REALTOR, Broker | www.juliahuntsman.com | 562-896-2609 | California Lic. #01188996

7/30/2021

Long Beach Market Update for July, 2021

As of July 1st-30th, the number of single family homes sold in Long Beach totaled 192, price ranging from $375,000 to $6,600,000.  The MLS shows that 39 sold under list price, all others sold at or higher than original list price, some times significantly higher--in all price ranges.  

For instance, 420 Monrovia Ave., in Alamitos Heights area of Long Beach, was listed at $2,299,000, on 6/18, then increased in price to $2,499,000, then sold on 7/26/2021 at $2,400,000.  It went into escrow the same day it became active in the MLS.

3817 Albury was listed at $549,900, and closed at $605,000, after 2 days on the market. 

Similar stories of a  sold price of $50,000 increase over list price are not unusual. 

The median Long Beach sale price for July was $705,000, where median list price was $705,000 and the median sale price was $738, 750.  The Long Beach average list price was $696,293, average close price was $714,770 with an average of 13 days on the market.

Yes, there are some properties that have been on the market for quite a while, still waiting for a buyer.  The longest is 346 days for a multimillion asking price in the Naples area, but another one listed for $799,000 has been waiting for a buyer for 114 days as of July 30th.  Park Estate, Belmont Heights, Carson Park, all have a few listings that are waiting for a buyer, so not absolutely everything is selling in less than a week, although buyers should be prepared for moving quickly on most properties.

There were 113 condos that sold in the same time frame, with the majority selling over list price also. But the median price is $436,500, median sell price is $445,500, days on market 12.

If you are thinking of selling, or would like to evaluate your possible sell price at this time, please contact me via phone or email.  I look forward to hearing from you!

Julia Huntsman, REALTOR, Broker | www.juliahuntsman.com | 562-896-2609 | California Lic. #01188996

6/29/2021

Is the California Real Estate Market Going to Fall in 2021?

California has just experienced the strongest house price ever recorded in May 2021.

In this housing presentation in May for Orange County Realtors, a lot of the  current market issues were covered by the CAR Economist Jordan Levine.

Statewide, prices are up overall $100,000 since 2006, and so are mortgage payments.  The highest dollar amounts cashed out in home equity were in the 2004-2007 years (as much as $80 billion in one year), and in 2020-2021 another increase in the $40-$50 billion range is here, explaining what?  Remodels? helping the adult children with their down payment?

Even with lower interest rates, affordability is not keeping up; 27% of Californians can buy a median priced home, compared to 50% in 2012. And building permits for single family homes has not increased significantly in 10 years--about 50,000 issued in 2020 compared to 150,000 permits issued in 1988. However, as affordability rate declines, the 2021 median home price is predicted to be $712,000 for the state, and in some areas is already higher than that. 

For a home evaluation, please contact me via text or email, even if you're not thinking of selling in the near future, an idea of your home's value whether condo, SFR or multi-unit, is wise to keep track of.

Julia Huntsman, REALTOR, Broker | www.juliahuntsman.com | 562-896-2609 | California Lic. #01188996

6/16/2021

May Housing Report for California

May 2021 Sales and Price Report
The market up until May has been at a dead heat for the buyers, but has been showing signs of a little cooling as some buyers may be taking a break.  However, as the economy is now reopening, how the market may change is yet to be seen.  

The higher end of the market has surged:

"Robust demand of higher-priced properties contributed to the record-setting statewide median price. With million-dollar home sales surging more than 200 percent from May 2020, its market share is nearly double what it was a year ago when it was at 15.6 percent. More million-dollar properties were sold in the past couple of months than homes priced below $500,000."    

Overall, the Southern California market grew by 33.1% increase in median price (surveyed from 90 California MLS systems) compared to May 2020. This was second only to the San Francisco Bay Area.  The unsold inventory statewide still remains under 2 months supply (meaning it would take only 2 months to sell all properties at the current rate of sale--the traditional normal was 6 months before 2012).   49 out of 51 counties dipped more than 20 percent in the number of active listings  compared to one year ago, however active listings were at the highest level in the last 6 months.

The 30-year mortgage interest rate was under 3% in May compared to 3.23 percent average in May, 2020. 

The Los Angeles metro area median single family home price for May was $725,000, compared to $535,000 in May, 2020.

Julia Huntsman, REALTOR, Broker | www.juliahuntsman.com | 562-896-2609 | California Lic. #01188996

5/22/2021

California April Sales and Prices, Higher Than Ever

 Inventory, Inventory, Inventory. There's less of it, and yet.... not everything is selling within 7 days. If you are interested in selling or buying and would like more in depth information about the current market in Southern California for residential properties, just contact me via phone or text. 

Why there are fewer homes on the market has more than one possible answer, but this shortage has grown since 2012, back when 6 months inventory was more the norm, not 1.6 months. 

Last September, Long Beach had 2 months supply of homes on the market, in April 2021 it was 1.1 months.  And this is the time of year when we traditionally see much higher inventory.  In the last 7 days, 79 homes and condos came on the market, but 77 closed in the same period, and 120 went into escrow.  So the new listings are not keeping up with the overall sold volume.  

To help the situation for some reluctant sellers, the passage of Proposition 19 can assist for certain age 55-and-over sellers, or disabled, or natural disaster victims, who want to minimize a change in their property taxes if they choose to move.   Or, if you plan on relocating, study in advance the areas that may be economic advantage to move to. And for certain sellers, a purchase with a reverse mortgage can be an option.  Selling first before buying is the most optimal for sellers, but if you  can't, you want to make sure that finding a new property is a #contingency in the contract with the buyer.

Buyers who are willing to accept a property that needs some work that fits in their budget may actually be able to find the right home.  Some of those properties have been sitting on the market for a while longer and without the fierce competition of multiple bids.  And feel free to use the property search tool on the site below.

 For more market information about your area of interest, please contact me via phone, text or email.

 Julia Huntsman, REALTOR, Broker | www.juliahuntsman.com | 562-896-2609 | California Lic. #01188996


4/08/2021

Housing Supply Stats for Los Angeles County, as of February 2021

LA County 2/21 Housing Supply

This graphic for Los Angeles County quickly shows a 27% decrease in listings compared to February of 2020.  This is a theme repeated over and over throughout other cities and the state. The top right bar graphs show in green where listings are this year compared to last year in red.  Last year's Time Trend show the huge dip as the pandemic conditions were being dealt with, and then an increase above the line  for 2021, but no where near the activity for 2020, shown in green bars. 

The pricing on Active Listings demonstrates the under-$200,000 market is very slim, with approximately one-third of the market priced between $300,000-$750,000, another (approximately) one-third between $1.0 million to $1.5 million, and the remaining third priced over $2,000,000.  All price ranges see a decrease in numbers of listings, but the largest deficit is in the lowest end of the market.


In the Home Price Interactive, the bottom right graph

Income vs. loan payment, LA County
shows how income has risen in Los Angeles County since before 2000, from $35,000 annually, up to the present $75,000 annual income.  But the payment line (green) has dipped up and down over time, reflecting the downtimes of the Great Recession and foreclosures after 2007, and  recovery period after that.  But according to this graph, the difference between current mortgage payment levels and annual income is at a midpoint, similar to the loan payment-annual income scenario prior to 2000.


 For a home valuation, please go to my website for an automated valuation, or contact me directly for a comparative market analysis.

Julia Huntsman, REALTOR, Broker | www.juliahuntsman.com | 562-896-2609 | California Lic. #01188996

3/16/2021

2020 Single Family Review for Los Angeles County

LA County House Snapshot for 2020
Last year saw a  consistent dip in all housing metrics after the beginning of the pandemic shutdown, but then a recovery began mid-year that hasn't stopped since.  The current market is marked with multiple offers and prices shooting upward since the end of January 2021.  The close of February showed an average house price for the County sitting at $1,232,890, an increase of 23% over one year ago, while the median price was $830,000.  February's average County-wide home price of $1,232,890 exceeds any average home price since 2008 and before. Some of the properties are seeing an increase of $50,000 sale price over list price, while others are  selling at or just above list price; one property in California Heights in Long Beach was listed at $699,000 and sold for $850,000.  It's not unusual for 15-20 offers or more, for houses that are move-in ready and partially or fully upgraded.  Months inventory, meaning how many houses are actually available for sale, is critically low, and it is this low inventory that fuels the upward price surge.  For January and February, months supply is 1.8 months (normal inventory supply is 6 months, but that's been gone since 2012).  Interest rates have been well below 3%, but with a recent increase in rates, mortgage applications have slowed. 

If you would like a market evaluation for your home or condominium, please contact me.  It's an ideal time to sell.


Julia Huntsman, REALTOR, Broker | www.juliahuntsman.com | 562-896-2609 | California Lic. #01188996

1/26/2021

Long Beach Sales Volume and Price Comparisons in 2020

2019-2020 Sales Volume Comparison, Long Beach

As broken down by area, the highest number of sales for 2019 and 2020 took place in the North Long Beach area, followed by the Bixby area and Lakewood Plaza.   Most areas had fewer sales in 2020, but Belmont Shore/Naples areas actually had higher sales volume in 2020 compared to 2019.

See how average Long Beach single family home price (blue) rose in 2020 compared to 2019 with lower inventory (green) for single family homes! The top average in 2019 was under $800,000, whereas the top average in 2020 was just under $1,000,000. The Corona virus and the restrictions placed on how homes were to be shown (for the really motivated buyers and sellers) the market prices continued upward, fueled by the lowest inventory and lowest rates seen in recent times.


2020 Average sales price Long Beach

2019 Average sales price Long Beach

Julia Huntsman, REALTOR, Broker | www.juliahuntsman.com | 562-896-2609 | California Lic. #01188996

10/02/2020

In the Middle of a Pandemic, the Real Estate Market is Healthy

Some astonishing facts about the current market:

    Interest Rates, Lowest Ever
  • Median home price in California is $700,000 (September), lowest interest rates have led to fastest sales growth in a decade;
  •  Average U.S. homeowner with a mortgage saw their equity rise over $9800 this year.
  • The number of homeowners in forebearance dropped to under 7%, according to the Mortgage Bankers Association (September)
  • The So Cal six county region broke a median price of $600,000 in August
  • September mortgage demand was up 25% from one year ago.

 To see how your opportunity exists, take a look at the sample $500,000 selling price for a house, where a 2.99% rate could be $325 dollars less every month than the next 4.27% rate next to it.  It saves monthly, and it may also help a buyer qualify better to get in a slightly higher priced home.

To find out more, please contact me.  I'll be happy to provide you with a home value report.

Julia Huntsman, REALTOR, Broker | www.juliahuntsman.com | 562-896-2609 | California Lic. #01188996

Web Statistics