Showing posts with label Market Direction. Show all posts

7/24/2024

Cash Buying Trends in 2024- Why Fewer Homes Are on Market

By 2010, the Great Financial Crisis had played its course long enough for lawmakers to pass the Dodd-Frank Act. Following the first major housing crash since the Great Depression and poor economic conditions, the act paved the way for recovering the financial market by strengthening regulations and oversight. Dodd-Frank was the key to preventing the same meltdown from ever happening again while creating another issue: The Supply Crisis. 

As a result of Dodd-Frank, fewer homes were placed on the market. Without high-risk adjustable mortgages, people could use their homes as a secure and unfailing hedge against inflation. Most buyers had excellent credit and great jobs and opted for fixed-rate mortgages. Since there were far fewer foreclosures and short sales, the United States national housing inventory slowly tumbled to record lows.

In response to COVID-19, mortgage rates dropped to historic lows, causing people to take advantage of a once-in-a-lifetime opportunity. For example, if a buyer desired a $5,000 payment (principal and interest) in November 2020 when the 30-year fixed rate was 3%, they were looking at a home priced just shy of $1.5 million. With today’s stubbornly high mortgage rate environment, currently hovering near 7%, that same buyer can only afford a home at $940,000. The difference of $542,500 between the two mortgage rates is enough to stop many would-be buyers from purchasing.

In a typical market, most home purchases are primarily made utilizing a mortgage, with a smaller percentage of buyers paying in cash. We can even see this in the auto industry, with financing (mortgage) and leasing (renting) being the two most popular ways to acquire a car. However, fewer people have sufficient funds to purchase a car, let alone a home.

From 2022 on, we’ve seen a swan dive of a decrease in existing home sales in the United States. With limited inventory and demand due to high mortgage rates, fewer transactions can take place. As a result, smaller factors and changes become more evident to the naked eye. One will even notice how mortgage rate fluctuations dictate where supply and demand can move in the future.

As affordability deteriorates over time, fewer people can afford a mortgage, explaining why there are fewer home purchases. While taking a closer look, one will notice that cash transactions have not changed much over time, yet have become a much larger percentage of all transactions. With not as much movement in the market, cash transactions are viewed in a larger scope, causing many to think the entire market has shifted towards cash.

Thankfully, high mortgage rates are not here forever. Eventually, there will be a gradual relief in the federal funds rate, causing mortgage rates to fall, as well as rates tied to cars, credit, or any consumer loans. With enough relief, expect to see a shift in the housing market. As soon as mortgage rates dip into the 5's, even 5.99%, a new market will emerge, a tidal wave of movement. More transactions mean that cash buyers will be a smaller percentage of the purchasing pool.

In May of this year, 24.5% of all closed sales in Southern California (Los Angeles, Orange, Riverside, San
Bernardino, and San Diego) were cash transactions, approaching a quarter of the entire market. The cash purchased homes represented 3,530 out of a total of 14,381. In a normal pre-covid average (2017-2019) market, for May, there would typically be just over 19,000 home sales. That difference is 4,797 homes or 33% extra home sales. If the same amount of cash homes were bought with the pre-covid May average (2017-2019) for existing home sales, 18% of all closed homes would have been closed in cash, which tells an entirely different story. Unfortunately, many have created a negative narrative around the inability to purchase today due to the competition of so much cash in the market.

PERCENTAGE OF CASH CLOSED SALES BY COUNTY : JANUARY - MAY
It is crucial to understand that today’s market is not permanent and is subject to change. When that will happen is entirely unknown.


Julia Huntsman, REALTOR, Broker | http://www.abodes.realestate | 562-896-2609 | California Lic. #01188996

Article by Brennan Thomas

9/13/2023

Statewide California Home Sales Facts for July, 2023


July California Sales and Price Report
Market Information - median  day to sell  down by 2 days; sales to list ratio is the same; price per square foot down by $2; 30-year fixed rate up over 1%....

Information from the California Association of Realtors about sales statewide:

  • The median number of days it took to sell a California single-family home was 16 days in July and 18 days in July 2022.
  • C.A.R.’s statewide sales-price-to-list-price ratio* was 100 percent in July 2023 and 100.0 percent in July 2022. 
  • The statewide average price per square foot** for an existing single-family home was $409, down from $411 in July a year ago. 
  • The 30-year, fixed-mortgage interest rate averaged 6.84 percent in July, up from 5.41 percent in July 2022, according to C.A.R.’s calculations based on Freddie Mac’s weekly mortgage survey data.


*Sales-to-list-price ratio is an indicator that reflects the negotiation power of home buyers and home sellers under current market conditions. The ratio is calculated by dividing the final sales price of a property by its original list price and is expressed as a percentage. A sales-to-list ratio with 100 percent or above suggests that the property sold for more than the list price, and a ratio below 100 percent indicates that the price sold below the asking price.

**Price per square foot is a measure commonly used by real estate agents and brokers to determine how much a square foot of space a buyer will pay for a property. It is calculated as the sale price of the home divided by the number of finished square feet. C.A.R. currently tracks price-per-square foot statistics for 50 counties. 

Thought for consideration: while interest rates are challenging for buyers, many are able to negotiate a buydown from the seller. For more information about how a buydown can help you, please contact me via text, phone or email.

Julia Huntsman, REALTOR, Broker | http://www.abodes.realestate | 562-896-2609 | California Lic. #01188996

8/08/2023

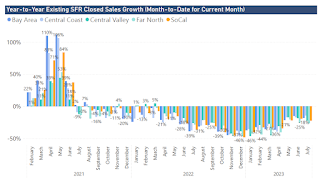
Closed Sales Volume in California, Southern California and Long Beach

May, June and July of 2023 down 18% in Southern California sales volume for single family homes, better than last December's volume which was down 46% (see the orange bar for Southern California).


Home sales volume bar graph statewide

Southern California home sales volume has been "below the line" for over two years, along with all areas of the state.

High homes prices and unfavorable rates continue to have influence for buyers, of which 41% believe prices will continue to climb. Those who believe it's a good time to sell continues at the rate of 64%, so inventory not loosening up much on the sell side. 

Although there's been a crunch on obtaining purchase home insurance in certain areas, the local market is still seeing buyers successfully closing their escrows.

In the last 30 days, 97 single family homes (average price $1,136,577) and 69 condominiums (average price $592,000) sold in Long Beach.

If you would like to find out more about selling, doing a 1031 exchange, or just find out more about the market in your area, please contact me via phone, email or text.  And please feel free to do a property search on my website.

Julia Huntsman, REALTOR, Broker | http://www.abodes.realestate | 562-896-2609 | California Lic. #01188996

11/04/2021

There's More to Buying and Selling Than the Click of a Button on Spreadsheets: Zillow

Front door
The real estate industry news has lately had quite a few stories about Zillow's "pause" in buying homes.  As the days went by, the "pause" was just another word for Zillow's decision to stop buying homes--why? because it made too many bad decisions about pricing, the market, and a third reason, what I consider to be its faulty reliance on its own automated valuation tool.  Zillow only recently became a real estate brokerage (in 2021) after many years of being a third party data aggregator, showing listings online in the way many companies did by obtaining permission from the various MLS's across the country, and by then offering advertising of these listings to the Realtors who listed them in the first place (for a price of course)  so that prospective buyers and sellers would have another portal by which to find listings and possibly a future agent.  You've probably heard of "Zestimates", their early automated valuation tool which was typically inaccurate, for various reasons.  One of the major reasons was that, as a non-broker, Zillow was not using the full information gained by subscribers to the Realtor MLS, but drawing from the "bare bones" information of the public property tax records.  Value of a property can be in the subjective eyes of the beholder, aside from the schooled requirements and standards used in the professional appraisal industry, and this intuitive factor was quite elusive to Zillow's valuation tools.  

And it continued along this same path after becoming a licensed brokerage (something it used to claim would never happen) and Zillow proceeded to buy, buy, and buy more properties with the intention of "buy, fix and sell".  Until in recent weeks it hit the "pause" button, and now its leadership says:

“We’ve determined the unpredictability in forecasting home prices far exceeds what we anticipated, and continuing to scale Zillow Offers would result in too much earnings and balance-sheet volatility,” CEO Rich Barton said in a statement.

Barton said that Zillow will instead focus on “creating an integrated and digital real estate transaction that solves the pain points of buyers and sellers while serving a wider audience.” (Quote from Realtor Magazine, Nov. 3, 2021, their sources from “Zillow Stock Dives After Analyst Highlights Two-Thirds of Homes Bought Are Underwater,” MarketWatch (Nov. 1, 2021); “Zillow Quits iBuying, Will Lay Off 25% of Staff,” The Real Deal (Nov. 2, 2021) and “Zillow Quits Home-Flipping Business, Cites Inability to Forecast Prices,” The Wall Street Journal (Nov. 2, 2021) [Log-in required.])

Ultimately, I think that the reference to "the pain points of buyers and sellers" is an acknowledgement that the purchase and sale of homes is indeed a human process, one that is full of an unfolding series of steps connected to what can be quite emotional associations and psychological
factors whether one is acquiring a home, or leaving it after many years.  

Make no mistake, automated valuation tools are widely used, not just by Zillow, and have been for a number of years.  But some can be much more accurate, especially when used in conjunction with market knowledge that comes from experience, "feet on the ground", and solid professional knowledge connected to working people.

Julia Huntsman, REALTOR, Broker | www.juliahuntsman.com | 562-896-2609 | California Lic. #01188996

4/02/2020

Pandemic: Local Housing Market Trends for March 2020

The single family home market in Long Beach, Lakewood, Huntington Beach and Cerritos, for March 2020 show average home price increases in all cities except Cerritos, which is down 6%. See the panel at the right of this blog for those graphs.

There is no question that the virus pandemic is currently influencing the markets.  Before mid-March, the average daily closed sales in 6 Southern California counties were  higher than at the end of March which shows a downward curve. Los Angeles County, for example, averaged 82 closings a day dropped to 67 average daily closings by the end of March.  The average daily new listings in Los Angeles County dropped from 135 to 98. Similar drops in new listings are in Orange, Riverside, San Bernardino, San Diego and Ventura.  It so far doesn't mean that sales have stopped, or completely will, but the trend is obvious at this point. On average, counties are down about 25% overall in listings.
So what is the hope here? Mortgage interest rates are low, and are set to stay that way for indefinite time this year.  Prior to the mid-March slowdown, California February sales volume was the highest in two years. Small business and unemployment assistance, and direct payments, were a start to fiscal stimulus.  In spite the media attention to what the pandemic will do to our world in the future, look at past events with SARS, MERS and Fukushima, and how the market recovered:


If current measures of social distancing are adhered to, and if the needed medical resources are obtained, the current projection is a decline by June 1.  But will we meet that?  Everything depends on how people follow the rules!!


If you have questions about how to sell your home in the current market, just contact me.  Necessary contract requirements such as physical inspections, appraisals, buyer inspection, etc., can be carried out within guidelines unless there is some stricter local level operating.  Virtual open houses minimize contact to keep to the absolute essential visit to a property.  For more on this, please contact me.  Email, phone, or text.

Julia Huntsman, REALTOR, Broker | www.juliahuntsman.com | 562-896-2609 | California Lic. #01188996

3/12/2020

What Are the Upcoming Market Impacts for Real Estate?; and Long Beach Sales Stats

The California housing forecast for 2020 from the California Association of Realtors may be revised downward, but this greatly depends on the length and quality of the viral outbreak.  On the one hand we have GDP growth impact, but then we have very low mortgage interest rates which can offset a slower economy.  California could still achieve a healthy housing market for 2020.

The number of reported new corona virus cases in China has begun to fall.  This stabilization there will take time to trickle across the globe.  A March 6-9 email survey of  California Realtors shows varying attitudes:  36% believed there would be no impact on home sales or time on market; 25% of Realtors said clients put home purchase or sale on hold; 33% of Realtors had clients asking market questions related to corona virus. Other areas some Realtors felt would be impacted  were prices, closing, and supply.

Turbulent financial markets actually make real estate relatively more attractive.

If consumers maintain their confidence, economic growth will continue.  There have been so many re-finances from consumers taking advantage of low rates, that the mortgage industry is swamped!  Some have even started to raise their rates online in reaction to all the re-fi's.  However, don't think it's not a great time to make a home puchase and profit by the low rates, because it is!

The other fact is that since 2012, the housing inventory has not risen to the level prior to 2012, this is one of the things that has kept housing prices higher in California.  So low interest rates at this time actually offset that fact, and make monthly mortgages more attractive due to rates.

Long Beach February Market for Single Family Homes:  Inventory at 1.6 months supply (extremely low number of homes on the market); average sales price $759,000; number of houses on the market is 276; average days on market is 32. 

Sellers, this is your time to sell!!!

If you have more specific question in regard to viewing property, or listing yours, please contact me via phone or email at any time!


Julia Huntsman, REALTOR, Broker | www.juliahuntsman.com | 562-896-2609 | California Lic. #01188996

12/04/2018

Average Sales Prices Mostly UP in Selected Long Beach Areas, Signal Hill and Lakewood for 2018

Lately, the internet is full of stories about softening prices, but it turns out to not be all true.  It depends on the city and overall region.  But take a look at these stats, taken directly from the CRMLS, which happens to be the largest MLS in the country with 96,000 subscribers and another 143,000 agents in participating MLS's.

Below are the average sales prices for single family homes, with the sales count for that period in parentheses (  ).  It was a little different than I expected--I chose these areas in Long Beach as representative of single family homes for different points in the city, and then chose Lakewood and Signal Hill as entire cities.

As you will see below, in most cases, for 2018, both average sales price and sales volume increased in the second 5 months of the year, compared to the first 6 months--not what I expected to see, especially in the highest price area of the city where properties are spending more time on the market.

Long Beach

Area 1 - Naples, Belmont Shore/Park, Marina Pacifica, Bay Harbor - UP
1/1 - 6/1 --   $1,220,951    (71)
6/2 - 12/1 -- $1,588,024    (90)

Area 2 - Belmont Heights, Alamitos Heights, Bluff Park - UP
1/1 - 6/1 --   $996,377       (44)
6/2 - 12/1 -- $1,106,803    (63)

Area 5 - Wrigley Area - UP
1/1/ - 6/1 --   $538,908      (50)
6/2 - 12/1 --  $574,446      (63)

Area 6 - Bixby, Bixby Knolls, Los Cerritos, California Hts - MIXED
1/1 - 6/2 --   $760,435        (101)
6/2 - 12/1 -- $749,131        (107)

Area 7 - North Long Beach - UP
1/1/ - 6/1 --  $447,282         (100)
6/2 - 12/1 -- $464,851         (165)

Areas 31,32,33,34 - Los Altos, Conant, Ranchos, Plaza, Stratford Square - UP
1/1/ - 6/1 --  $696,026         (187)
6/2 - 12/1 -- $716,253         (252)

City of Signal Hill - UP
1/1/ - 6/1 --  $747,303         (27)
6/2 - 12/1 -- $872,874         (23)

City of Lakewood - UP
1/1/ - 6/1 --  $589,653         (314)
6/2 - 12/1 -- $612,165         (401)

If you are interested in selling for 2019, or would just like some idea at this point of your market value, please contact me directly via text, phone or email.


Julia Huntsman, REALTOR, Broker | www.juliahuntsman.com | 562-896-2609 | California Lic. #01188996

5/22/2018

Where are California's Foreign Buyers Coming From?

Foreign buyers in California
Here is a question recently posed to CALMatters, a website dealing in housing data for California, "How much are foreign buyers and investment firms—two of the most common sources of all-cash transactions—impacting the average California family’s ability to buy a home?"

All cash sales have been the nemesis of buyers for over a decade.  As prices rise, many lower priced homes get snapped up by investors wanting to build a rental portfolio, investors who want to flip properties, or buyers who, if not paying all cash, have a 50% down or more down payment.  International buyer numbers have grown, especially on the West Coast, especially in areas such as San Gabriel Valley, Arcadia, San Marino, Newport Beach and Irvine, where buyers from China gained a foothold in the past and have increasingly congregated over time.  For Chinese buyers in particular real estate investment is a good strategy, they view American properties as "cheap" compared to what investments cost them in the city/country of origin.   While China has been eyed as the competition by buyers here, the fact is that "As recently as 2014, Canadians purchased more U.S. homes than Chinese buyers, according to the National Realtors Association.  But right now foreign investors are also favored by the EB-5 visas which grant green cards to large investors.


But the truth is that citizenship or national origin is not specifically a part of any real estate transaction, so there are assumptions made based by tracking the cash transaction statistics, because it is believed such foreign buyers are one of the impacts on prices here.  The British Columbia government levied a 15% sales tax on foreign home buyers to curtail the market impact in areas such as Vancouver, but prices are still out of reach of the average family there. Another rule limiting Chinese buyers from taking more than $50,000 to bring here has had some impact, but there may still be ways for purchases to be accomplished.  There are arguments over the impact of foreign buyers on statewide pricing, as they tend to target certain properties in some areas.  Obviously, there are other things having an impact, such as all the properties bought in the down market by investors which are still off the market and held for rentals, and the fact that fewer housing units are built to keep up with demand. 

So how many properties have been cash transactions in Southern California?   Go to this interactive map to find your area.  Overall, since 2013, percentages range from 13% to over 30%.  Long Beach 90803 zip code is 21%; 90802 is 28%, Newport Coast 33%, Signal Hill 13%,  whereas Malibu is 38% cash sales.

Some information is available here for foreign investors. If you wish to buy in Los Angeles or Orange Counties, please contact me for a comprehensive look at the market, referrals to financing, and details on properties currently on the market.  I am a Realtor with over 22 years of experience, and a Southern California native.


4/21/2016

Sales Volume in Los Angeles County is Down, Prices Continue Upward in 2016

Long Beach, a great city to live in.
The median price of an existing, single-family detached Los Angeles County home rose in March to $545,000 from $535,250 in February. The March 2015 median price was $510,000.  All data comes from Realist. The median sales price is the point at which half of homes sold for more and half sold for less; it is influenced by the types of homes selling as well as a general change in values.

But while prices are going up in the County as a whole, sales volume has decreased dramatically:
the number of single family homes sold in March 2016 was 1,853; in February, 2016 it was 3,924; in March 2015 homes sold was 6,380 and in February, 2015 it was 5,109.  This is a sales volume decrease of 50% and greater compared to the same time last year.

The 2016 sales volume for Orange County is a similar picture, but with lower numbers: total SFR sales are 1432 and 1407 for February and January, respectively.

Less inventory means much more competition for buyers in Long Beach, especially in the lower prices range under $500,000 which sell in 40-60 days on average (or less), while properties in the $1,000,000-plus range are on the market for well over 90 days on average.

While housing prices continue upward, housing affordability in California is increasingly a topic of concern.  Another indication of housing prices is that investors are buying fewer single family and multi-family properties.  California Association of Realtors's 2016 California Investor Survey found 10 percent of real estate investors purchased more of the other types of properties, such as commercial, land, and mobile homes, in the past year compared to previous years.

Lack of inventory, especially in Southern California, can be an issue for sellers who want to move on--but for those moving out of the area, or for those who have all cash for a purchase, the ability to move on may be much easier, and would bring more housing inventory onto the local market for sale. From that standpoint, it's a good time to sell while interest rates are still so low.  Please contact me for a customized report on home value for your property!


4/16/2015

Market Stats for 1st Quarter, Long Beach CA and Nearby Cities


Not surprisingly, with the low low interest rates, prices have climbed especially with single family homes.  Condo prices have varied, and do vary by zip code, especially in Long Beach where completely different areas have their own pricing.  All median prices in the chart below are for cities regardless of specific areas, and this chart is meant to show an overall trend for the 1st quarter of 2015:

MEDIAN SALES PRICES1/1/20153/1/2015
Long Beach Single Family$482,500$540,000
Long Beach Condo$310,000$275,000
Long Beach Multi-Family$599,000$620,000


Lakewood Single Family$443,500$475,000
Lakewood Condon/a$300,005
Lakewood Multi-Family$452,000$579,000


Cerritos Single Family$602,000$638,000
Cerritos Condo$285,000$453,000
Cerritos Multi-Familyn/an/a


Bellflower Single Family$418,000$395,000
Bellflower Condo$300,000$280,000
Bellflower Multi-Family$550,000$602,000
Data provided by Market Analyzer

8/05/2014

Prices Continue Up for June in Many Cities, But Sales Volume Way Down


Average single family home prices in June, 2014, and the increase or decrease compared directly to June of one year ago (prices may differ from overall annualized price), plus stats on closed sales and days on market (DOM).  Actual number and percentage of sales are down (see red column), a lot; properties are usually spending more time on the market before going into escrow (last column); and the average house price, on a citywide basis, is higher than one year ago.  The percentage increase in price, however, is lower compared to May's increases, in many areas. (P.S. See my new Metro Summary page for Long Beach region info for July).
     

Cerritos$739,333+10.8%Closed Sales-40%DOM +27.8%


Lakewood$463,096+7%Closed Sales-32%DOM +8%


Long Beach$555,496+17%Closed Sales-28.4%DOM +58%


Los Alamitos$726,667+9%Closed Sales-57%DOM +72%


Seal Beach$1,021,223+14%Closed Sales-20%DOM -33.3%


Signal Hill$655,000+7%Closed Sales-75%DOM +87%


Huntington Beach$920,396+19%Closed Sales-21%DOM +68%


Norwalk$340,943+9%Closed Sales-8%DOM +5%


Downey$444,903+8%Closed Sales-24%DOM +59%  


Garden Grove$503,922+15%       Closed Sales-58%DOM -9%


1/29/2014

The Overall Picture for Long Beach Area Real Estate for 2013

The market has increased in price! 2013 saw upward jumps in most areas for the average annual sales price of a single family home:
  • Long Beach, increased to $489,000, +18%.
  • Cerritos, $605,000, +11%.
  • Lakewood, $420,000, +17%.
  • Huntington Beach, $803,000, +10%.
  • Signal Hill, $600,000, +13%.
  • Los Alamitos, $686,000, +9%.
  • Seal Beach, $947,000, +25%.
  • Cypress, $532,000, +17%.
  • Norwalk, $318,000, +17%
  • La Palma, $576,000, +18%.
  • Bellflower, $356,000, +15%.
  • Garden Grove, $443,000, +17%.
Along with price increases, there are: multiple offers as new buyers compete with each other and with investors, all cash purchasers, inventory shortages, sellers reaching for too high a price in some cases, an overall upward movement in mortgage interest rates, new lending rules which may have a tightening effect for some borrowers, and more buyers in the market who are emerging from a past foreclosure or short sale and are looking to buy again. And, appraisals continue to be an issue.

Keep in mind, pricing for condos, and 2-4 unit properties would be different, and should you want to know specific pricing for your city or zip code (south Los Angeles County and north Orange County areas), please contact me. 
This data is current as of January 6, 2014, and all data comes from the MLS.


12/03/2013

What Are October Selling Prices in Long Beach/Cerritos/Lakewood Areas?


The average selling price for a single family home (based on MLS sales prices) for October 2013:

Long Beach - $541,985.

Cerritos -  $628,750.

Lakewood - $441,549.

Los Alamitos (including Rossmoor) -  $713,804.

Seal Beach - $910,563.

Cypress - $551,328.

San Pedro - $525,594.

Huntington Beach - $885,767.

The overall October snapshot of the local Long Beach metro area market (south LA and north Orange Counties) is that total sales are down compared to one year ago by about 18%, median sales price (the midpoint of all sales) is up by 20%, and listing inventory is down by almost 25% overall.

Build your own auto e-mail, and find and search properties in all cities in the area, and go to http://www.juliahuntsman.com/market-trends-report.html for more market information.

5/07/2013

Los Angeles County (South) and North O.C. Tell Interesting Stories Of Prices, Sales and Inventory

The latest market updates for April, 2013, are out for the south Los Angeles County and North Orange County cities--and here is a breakdown of stats for single family homes in local cities (all comparisons are a one-month comparison of April 2013 to April 2012, not on an annual basis):
  • Long Beach  -- New listings are up 4% for April 2013; the median sales price has increased 25% to $440,500 (citywide figures); the average sales price is $495,000, an increase of 27%. Listing inventory has decreased by 62.6%, with 1.4 months of inventory at the end of April.
  • Cerritos -- New listings are up 25% for April 2013; the median sales price has increased 8% to $573,000 (citywide figures); the average sales price is $615,758, an increase of 14%. Listing inventory has decreased by 78%, with 1 month of inventory at the end of April.
  • Lakewood -- New listings are up 8.2% for April 2013; the median sales price has increased 12% to $405,000 (citywide figures); the average sales price is $413,000, an increase of 14%. Listing inventory has decreased by 76%, with .8 months of inventory at the end of April.
  • Signal Hill -- New listings are down 42% for April 2013; the median sales price has increased 18% to $594,750 (citywide figures); the average sales price is $529,875, an increase of 8.8%. Listing inventory has decreased by 77%, with 1.8 months of inventory at the end of April.
The general picture is: prices have gone up, and inventory for all properties (houses and condos) is down compared to last year this time, with the lone exception of Avalon (Catalina Island), where inventory is actually up 17% but the median market price is down 33%.   Areas with the greatest increase in median market price tended to be lower priced areas in the past, and are now attracting buyer attention, Bell Gardens and Stanton being two examples.  Los Alamitos (including Rossmoor area) actually decreased by about 6% in median price.  Long Beach stands out at the top of the list of all area cities for the greatest number of closed sales in April at 324 and the most new listings, followed by Irvine at 264 closed sales, then by Anaheim and Huntington Beach.  Of the 68 cities included in the geographic area, only 4 are showing a decrease in median price!

Do you want to know what's going on in your zip code? It's sometimes a different picture than the surrounding city. Get the picture now by giving me a call or e-mailing me, so that you can stay up with your market.

12/31/2012

Summary for Recent Real Estate Trends at end of 2012

Happy New Year for 2013 -- there are positive signs in the housing market, and we hope that they will continue!

Pending home sales continue to rise (Pending means those in escrow, scheduled to close), as shown by the Pending Homes Sales Index which rose nationally by 1.7%, and is at the highest level in the last two-and-one-half years.  Pending homes sales have risen consecutively for the last 19 months.
The November median price for a single family home in the Los Angeles Metropolitan Area rose to $327,840 from $269,440 in November, 2011!  The share of distressed sales (mostly REOs and short sales) for single family homes in the Los Angeles area has decreased to 35% from 46% one year ago.

The market is not determined just by whether the prices go up or down, there are a lot of other factors, including whether or not sellers are motivated to sell because that in turn depends on other economic factors which create the movement in housing.  Inventory is a big issue right now, no question of it.

How will the "fiscal cliff" measures affect real estate (still not resolved as of this moment)?  An unrenewed date for the Mortgage Debt Relief Act will require homeowners who went through short sales, loan modifications and other resolutions to pay taxes on forgiven debt. And will the mortgage interest tax deduction be reduced or removed? That will affect most homeowners in the country if that happens.

Will borrowers be subjected to new mortgage rules in 2013? The lending environment is already stringent, making it difficult even for some 20% down borrowers, so buyers should be aware if how conventional vs. FHA loan opportunities could work for them in the future. The topic of "qualified mortgage" rules is being examined in the coming year, and the big question is will it mean that all borrower for conventional loans be required to put down a minimum of 20%--that's a tough hill to climb.

There is some good news in the housing market now, but it will need economic support in a variety of ways to keep that going.

If you have a reason to sell, please contact me for a free evaluation of your home's value! Find properties at www.juliahuntsman.com for the latest area listings of all residential properties.

12/18/2012

Increase of 24% in November Home Values in California Since 2011

November median prices for home sales in California have increased by double digits compared to one year ago, and the number of sales have also increased on a year-over-year basis as well.

Higher priced homes sold at increased numbers in November, even as sales declined overall in lower-priced areas due to fewer homes available for sale. In the Long Beach/Lakewood/Cerritos area, homes under the $500,000-$450,000 range in particular have sold very fast with multiple bids.  The California statewide median price for a single family detached home increased in November to $349,300, up from October's median of $341,370, an increase of 2.3%.  November's median price was up 24% from the November, 2011, and that is the biggest year-to-year increase since June, 2004!

Additionally, California's inventory for single family homes is down to 3.1 months overall (in some areas such as Riverside County, it's far less), and this is a decrease from 5 months of inventory one year ago.

Interest rates have dipped further to a November average of 3.35% for a fixed-rate 30-year mortgage; and it's taking fewer days to sell a home: an average of 37 days compared to 56 days one year ago.
Long Beach declining inventory 2012
Long Beach Housing Inventory Graph
 
In Los Angeles County, the median price is $337,000, an increase of 15% from one year ago, with the unsold inventory index at 2.9 months, down from 5.6 months one year ago (that means all existing unsold housing would sell at the current rate of sale within 2.9 months if no new listings come on the market--six months of inventory is more the number we should have.) And, this picture on inventory is not unique to Long Beach, it is typical of the local cities, county, state and national status of housing inventory.

As a side note, appraisals and buyer's lender financing issues have not away, which are topics for another post.
With the increase in prices, more homes are getting a little more equity--to find out what your values could possibly be, please find out your home's value from current and complete information directly from our Realtor MLS and tax inventory.  Even if you have no intention of selling in the near future, you may need market information about your property for a variety of reasons, such as re-financing, planning an estate, or just for your own information.

P.S. For a little Christmas spirit, see my photos of a few decorated houses at www.facebook.com/longbeachhomesandcondos -- and "like" me too.

9/27/2012

Los Angeles and Orange Counties Home Price Snapshot

Orange County's median single family home price was Orange County $567,710 in August 2012, up from $551,160 in July 2012, and up from $508,910 in August 2011.

Median price of a single family home in Los Angeles County was $344,770 in August 2012, up from $334,190 in July 2012, and up from $312,900 in August 2011.

4/16/2012

Long Beach Needs More Single Family Homes on the Market!

Long Beach Inventory
Long Beach--two months inventory
For the last year, since March 2011, the Long Beach median prices have been jumping around.  The median prices for listings and sales have gone up and down for the city, overall. These charts show the overall market, which varies in price quite a bit, and lumps all distressed properties in with regular sales.  In March of last year, the median price was $365,000, and for March of 2012, the price is $369,900--while the "sold" prices have actually gone down. But what is in escrow? That's where the prices in 1-3 months may be showing an upward trend, because sales activity has picked up a much faster pace:  the number of single family properties (both distressed and regular sales) in escrow is up 40%, and is at the highest number in the last 12 months.

Long Beach Median Price march 2012
Median price for listings is up again in Long Beach
And another thing is very clear: in checking with Long Beach, Lakewood and Cerritos, all cities are down to two months or less of inventory for single family houses. The second chart clearly shows a downward trend in numbers of listings on the market since last summer.

That means if no new listings came on the market, the current inventory would be sold in approximately 2 months at the current rate of sale.
Sellers should start contacting their real estate professional now to review their best position for selling, because the buyers, both investor and owner-occupant types, are buying!

I am available to help you as your real estate professional, just give me a call, e-mail me, or contact me through my website at www.juliahuntsman.com.

Web Statistics