Showing posts with label Sales Volume. Show all posts

5/13/2024

Total Amount of Dollar Sales Lakewood, Long Beach April 2024: Currently vs. 2 Years Back

CSULB Pyramid

Long Beach April Volume


Lakewood April Volume

The charts represent total sales volume in millions of dollars for single family homes in April in the last 3 years. 

The 2022 volume in both cities is higher than at present, the pandemic had certain market impacts, in particular very low interest rates which sparked highly competitive market bidding throughout most markets.

The rise in interest rates since 2022 has impacted inventory, however in Long Beach it has improved over last year's low dip.  Average days on market in April was 21 days in Long Beach, but April saw only 105 closed sales, compared to 185 in April of 2022.  In Long Beach the average number of showings before there is an accepted contract has increased to 8 showings, compared to less than 6 in 2022 (when many listings had showings with a line outside the home allowing for a maximum of 15 minutes for each buyer).

The Long Beach average single family home price for April is $1,113,599. 

Long Beach condo sales volume is up from last year at over $86 million, but still much less than  the $112+ million in April of 2022.

Lakewood condo volume in 2023 and 2024 is far less than the April 2022 volume, currently at $1,230,000; average days on market is at 21 days, much higher count than the last 2 years.

Lakewood single family homes are on the market for 20 days, compared to 8 in 2022, but the average number of showings to get a contract has decreased to 4, much lower than the last two years--so buyers are acting quickly.   

Lakewood single family home average selling price is currently $873,184.

For a breakdown of selling prices in your neighborhood, city or zip code, please contact me for a market report showing price, bedrooms, bathrooms, square footage and address in a given time period.


Julia Huntsman, REALTOR, Broker | http://www.abodes.realestate | 562-896-2609 | California Lic. #01188996
6/19/2023

Housing Affordability for California Buyers, Up or Down?


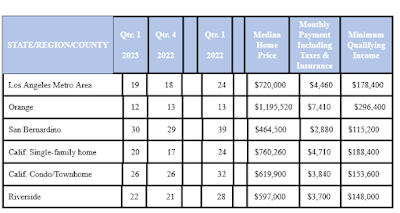
Housing affordability brightened somewhat in the 1st Quarter of 2023 since interest rates have dipped, see several areas below for comparisons.  The first three columns are the percentage of homebuyers who could buy the median priced home*:

Affordabilityfor homes chart prices California
Regional/State Chart for home prices in California

*Above chart from CALIFORNIA ASSOCIATION OF REALTORS® Traditional Housing Affordability Index First quarter 2023

 These figures exist for all counties, but four major areas are selected above, plus statewide figures for single family home and condos.

As has been widely stated, inventory is down, therefore total sales volume is down, 2023 units are projected to reach 279,000 units, down from the 342,000 units sold in 2022. Will home prices decrease as predicted (in blue print)? The public will have to stay tuned on both prices and interest rates:

"C.A.R. also announced it has revised its 2023 Housing Market Forecast and projects existing single-family home sales to reach 279,900 units in 2023, a decline of 18.2 percent from the 342,000 units sold in 2022. While home prices in general are expected to improve in the second half of the year, the California median home price is projected to decrease 5.6 percent to $776,600 in 2023, down from the annual median price of $822,300 recorded in 2022. The updated projection on the statewide median price, however, is an increase from the estimate of $758,600 forecast last October. C.A.R. also projects the 30-year fixed mortgage interest rate to average 6.3 percent for the year.

Julia Huntsman, REALTOR, Broker | http://www.juliahuntsman.com | 562-896-2609 | California Lic. #01188996

Web Statistics