Showing posts with label Inventory. Show all posts

6/19/2023

Housing Affordability for California Buyers, Up or Down?


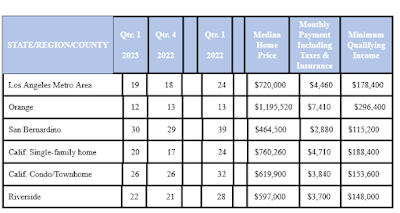
Housing affordability brightened somewhat in the 1st Quarter of 2023 since interest rates have dipped, see several areas below for comparisons.  The first three columns are the percentage of homebuyers who could buy the median priced home*:

Affordabilityfor homes chart prices California
Regional/State Chart for home prices in California

*Above chart from CALIFORNIA ASSOCIATION OF REALTORS® Traditional Housing Affordability Index First quarter 2023

 These figures exist for all counties, but four major areas are selected above, plus statewide figures for single family home and condos.

As has been widely stated, inventory is down, therefore total sales volume is down, 2023 units are projected to reach 279,000 units, down from the 342,000 units sold in 2022. Will home prices decrease as predicted (in blue print)? The public will have to stay tuned on both prices and interest rates:

"C.A.R. also announced it has revised its 2023 Housing Market Forecast and projects existing single-family home sales to reach 279,900 units in 2023, a decline of 18.2 percent from the 342,000 units sold in 2022. While home prices in general are expected to improve in the second half of the year, the California median home price is projected to decrease 5.6 percent to $776,600 in 2023, down from the annual median price of $822,300 recorded in 2022. The updated projection on the statewide median price, however, is an increase from the estimate of $758,600 forecast last October. C.A.R. also projects the 30-year fixed mortgage interest rate to average 6.3 percent for the year.

Julia Huntsman, REALTOR, Broker | http://www.juliahuntsman.com | 562-896-2609 | California Lic. #01188996

3/06/2023

Housing Inventory/Supply in Southern California - It's a Big Issue

Data as of 2-24-2023 - Market Summary
Housing inventory has been an issue for about 10 years, but one bright spot in the graph shows that, overall, inventory in Los Angeles County has increased to 3.1 months supply as of December, 2022. According to data released by California Association of Realtors, this is an increase of 138%+ compared to 2021 when the houses were being consumed by multiple offers in a matter of days.  It's also an overall increase compared to previous years when inventory was as low as one month in many cities/neighborhoods. But it's still 50% lower than what is considered the traditional time for inventory supply:  which is 6 months, meaning that at the present rate of sale, it would be 6 months before there were no houses left to sell if no new properties came on the market during that time.

The inventory increase shows similar levels for statewide and nationwide, but is still well below the 6 month standard. What is completely obvious is the $200,000+ income required to purchase in Los Angeles County and California as a whole compared to the lower national average of $94,400.

Graph of sellers in Jan and Feb
Steven Thomas, Southern California economist who publishes Reports on Housing, follows the market in his weekly videos on You Tube and Facecook.  In his lastest weekly report, new listings are down 41% in January, and February is down 40%, or a total of 17,000 missing for sale signs in Southern California, with San Diego being the most affected. Note the graph lines showing levels in years since 2015, and where we are now.  One of the major reasons, according to him, for the lack of inventory are the very low interest rates current property owners are enjoying--not giving enough incentive to move.

If you would like to find out about the selling process for your house, condo or 4-unit property, please contact me for vital information about selling, whether yours is an owner-occupied property or investor owned.

#marketvalue #LongBeachrealestate #housinginventory

Julia Huntsman, REALTOR, Broker | http://www.juliahuntsman.com | 562-896-2609 | California Lic. #01188996
10/05/2022

House Representatives Introduce Bill to Increase Capital Gains Exclusion

The "More Homes on the Market Act" was introduced on September 29th by Jimmy Panetta (D-CA) and Mike Kelly (R-PA), proposing increases in the capital gain exclusion amounts.  Under this bill, the exclusion amount of the sale of a principal resident for single filers would increase to $500,000 (now $250,000) and to $1 million (now $500,000) for joint filers.

homeowners may gain capital gains increase
Homes May Benefit from New Capital Gains Bill

This bill would provide tax relief for California homeowners, who are experiencing one of the highest cost markets in the nation, who have been unable or not wanting to move because of the large tax burden that  could result if they sold in the current market.  Senior citizens are more likely to face a larger tax burden since they have on average lived in their homes longer than younger age groups. 

The current capital gains exclusion was passed 25 years ago, with no indexing for inflation, in a different market which was not experiencing such huge equity gains. According to Rep. Panetta, "The current exclusion amount was first set in 1997 and was not indexed to inflation. If it had been indexed for inflation, it would be $461,325 for single filers and $922,650 today," amounts similar to the current proposed exclusion.  The new proposed bill does include indexing for inflation.

The current capital gains rate is  concurrent with fewer homes are on the market, which has contributed to higher demand and higher prices.  The National Association of Realtors estimates that single (95%) and married homeowners (68%) who purchased before 2000 could face capital gains tax if they sold their homes this year.


Julia Huntsman, REALTOR, Broker | http://www.juliahuntsman.com | 562-896-2609 | California Lic. #01188996

11/15/2021

November Active Listings Report in Five So Cal Counties

No housing market crash for 2022, at least not in terms of price (believe it or not!).

But there is a huge continuing problem between supply and demand-- very limited supply and huge demand brought on by very low interest rates. In beginning of 2019 there were the most homes (40,000 homes) on market since 2012, but lowered interest rates that year started off low inventory in 2020 (29,000 homes) with a big dip after the pandemic, and then the lowest inventory in years in 2021 (17,000 homes), and will continue this way into 2022.  We should have more than double the inventory we have right now, per last year's inventory levels.  The five counties in Southern California are all down in total home inventory between 3% and 5%, with Orange County at its lowest inventory ever (just over 1700 homes on market right now--on (l1/12/221)**

(Julia's Update Note:  Active listings in the MLS on 11/15/21:  San Bernardino County:  2515 single family homes; San Diego: 1550 single family homes; Orange County: 1182 homes; Los Angeles County: 5000+ homes; Riverside County: 2856 homes.)

Interest rates will probably stay under 3.5%, and it will still be a seller's market.  As long as rates stay low, the market will favor sellers, a trend that may well continue all through 2022.  Home values will continue to rise. And see the CAR 2022 Market Report Summary, an upward increase of 5.2% is predicted with total downward trend in number of sales for next year.

Calif Assoc of Realtors 2022 Market Report
 

** Information thanks to Steven Thomas and his weekly Facebook streaming Market Report every Friday)


Julia Huntsman, REALTOR, Broker | www.juliahuntsman.com | 562-896-2609 | California Lic. #01188996

5/22/2021

California April Sales and Prices, Higher Than Ever

 Inventory, Inventory, Inventory. There's less of it, and yet.... not everything is selling within 7 days. If you are interested in selling or buying and would like more in depth information about the current market in Southern California for residential properties, just contact me via phone or text. 

Why there are fewer homes on the market has more than one possible answer, but this shortage has grown since 2012, back when 6 months inventory was more the norm, not 1.6 months. 

Last September, Long Beach had 2 months supply of homes on the market, in April 2021 it was 1.1 months.  And this is the time of year when we traditionally see much higher inventory.  In the last 7 days, 79 homes and condos came on the market, but 77 closed in the same period, and 120 went into escrow.  So the new listings are not keeping up with the overall sold volume.  

To help the situation for some reluctant sellers, the passage of Proposition 19 can assist for certain age 55-and-over sellers, or disabled, or natural disaster victims, who want to minimize a change in their property taxes if they choose to move.   Or, if you plan on relocating, study in advance the areas that may be economic advantage to move to. And for certain sellers, a purchase with a reverse mortgage can be an option.  Selling first before buying is the most optimal for sellers, but if you  can't, you want to make sure that finding a new property is a #contingency in the contract with the buyer.

Buyers who are willing to accept a property that needs some work that fits in their budget may actually be able to find the right home.  Some of those properties have been sitting on the market for a while longer and without the fierce competition of multiple bids.  And feel free to use the property search tool on the site below.

 For more market information about your area of interest, please contact me via phone, text or email.

 Julia Huntsman, REALTOR, Broker | www.juliahuntsman.com | 562-896-2609 | California Lic. #01188996


4/08/2021

Housing Supply Stats for Los Angeles County, as of February 2021

LA County 2/21 Housing Supply

This graphic for Los Angeles County quickly shows a 27% decrease in listings compared to February of 2020.  This is a theme repeated over and over throughout other cities and the state. The top right bar graphs show in green where listings are this year compared to last year in red.  Last year's Time Trend show the huge dip as the pandemic conditions were being dealt with, and then an increase above the line  for 2021, but no where near the activity for 2020, shown in green bars. 

The pricing on Active Listings demonstrates the under-$200,000 market is very slim, with approximately one-third of the market priced between $300,000-$750,000, another (approximately) one-third between $1.0 million to $1.5 million, and the remaining third priced over $2,000,000.  All price ranges see a decrease in numbers of listings, but the largest deficit is in the lowest end of the market.


In the Home Price Interactive, the bottom right graph

Income vs. loan payment, LA County
shows how income has risen in Los Angeles County since before 2000, from $35,000 annually, up to the present $75,000 annual income.  But the payment line (green) has dipped up and down over time, reflecting the downtimes of the Great Recession and foreclosures after 2007, and  recovery period after that.  But according to this graph, the difference between current mortgage payment levels and annual income is at a midpoint, similar to the loan payment-annual income scenario prior to 2000.


 For a home valuation, please go to my website for an automated valuation, or contact me directly for a comparative market analysis.

Julia Huntsman, REALTOR, Broker | www.juliahuntsman.com | 562-896-2609 | California Lic. #01188996

3/16/2021

2020 Single Family Review for Los Angeles County

LA County House Snapshot for 2020
Last year saw a  consistent dip in all housing metrics after the beginning of the pandemic shutdown, but then a recovery began mid-year that hasn't stopped since.  The current market is marked with multiple offers and prices shooting upward since the end of January 2021.  The close of February showed an average house price for the County sitting at $1,232,890, an increase of 23% over one year ago, while the median price was $830,000.  February's average County-wide home price of $1,232,890 exceeds any average home price since 2008 and before. Some of the properties are seeing an increase of $50,000 sale price over list price, while others are  selling at or just above list price; one property in California Heights in Long Beach was listed at $699,000 and sold for $850,000.  It's not unusual for 15-20 offers or more, for houses that are move-in ready and partially or fully upgraded.  Months inventory, meaning how many houses are actually available for sale, is critically low, and it is this low inventory that fuels the upward price surge.  For January and February, months supply is 1.8 months (normal inventory supply is 6 months, but that's been gone since 2012).  Interest rates have been well below 3%, but with a recent increase in rates, mortgage applications have slowed. 

If you would like a market evaluation for your home or condominium, please contact me.  It's an ideal time to sell.


Julia Huntsman, REALTOR, Broker | www.juliahuntsman.com | 562-896-2609 | California Lic. #01188996

8/20/2020

The Pandemic Has not Lowered Prices, Nor Kept Buyers from Buying

 Realtor.com just came Downtown Long Beachout with its study of the 10 hottest zip code markets in the U.S., based on turnover and number of views of the property.   (See links below.)

At the top of the list is Colorado Springs, followed by the rest which are located outside of California.  

But overall, the pandemic market has not lowered prices, nor kept buyers from buying.  

 Locally, zip code 90803 (Long Beach, Naples, Belmont Shore, etc.), one of the most expensive certainly in Long Beach and elsewhere, had an average sales price of $1,473,357 ending in July, but turnover has slowed somewhat for that price range, over 80 days average, 60 days median, on the market before going into escrow.  

By contrast, east Long Beach including Park Estates and Los Altos areas was a median of 10 days on the market, 27 average days on market, at average sales price of 870,877.

Going to west Long Beach,  to 90810, the average sales price was $519,045 and houses sold on average in 21 days,

 Going to north Long Beach, to 90805, the July average sales price was $539,559 with average days on market at 15 days.

 So with lower priced markets that are more affordable, the days on market is gradually shorter.

Overall, the entire City of Long Beach finished July with only 2 months supply of inventory, continuing the demand for more listings to accommodate the buyers who are looking and constantly competing with each other in this market.   Nearby cities of Cerritos, Bellflower, and Lakewood are in the same low inventory crunch, less than 2 months of inventory.

Compare the Long Beach prices (lower compared to other  coastal cities) to the hot zip codes in the Realtor.com study:   https://www.realtor.com/research/hottest-zip-codes-2020/ where the median list prices are under $644,000!!  And yet, buyers throughout Southern California are looking for sellers who want to sell.  

Will homes sales continue to defy expectations?  Here's more from chief economist Lawrence Yun with National Association of Realtors,  Defying Expectations

If you or someone you know is interested in selling, I can show you how to get your house on the market and get it sold.

Julia Huntsman, REALTOR, Broker | www.juliahuntsman.com | 562-896-2609 | California Lic. #01188996

5/15/2020

The April, 2020 Market in Long Beach, Bellflower, Lakewood and Cerritos


In spite of 2020's global health and economic pandemic issues, the Southern California housing market continues to move on. 

As of the end of April, the Long Beach average single family home price increased almost by 9% compared to one year ago.  The Cerritos single family home price increased by over 21%, Bellflower increased over 20%, while Lakewood increased by 4%. 

But what else is happening?  While the price went up, the supply of inventory compared to April 2019 continued downward, as it was already doing for months.  Bellflower's inventory decreased by 50%, Long Beach decreased by 12%,  Lakewood by 37%, and Cerritos decreased by 52%.  Also, houses sold much faster compared to one year ago, the days on market decreased 27%-66% across the four cities.
And, contrary to some buyers' expectations, April selling prices also stayed within 3% of the original list price. 

Not just in April, but actually since 2012, available inventory has been one of the biggest issues for buyers, because a limited supply tends to drive prices upwards.  There are numerous reasons for the limited supply, beyond the purpose of this particular post, which have been discussed elsewhere. 

But it can only be said again, that if you are an interested seller, maybe not even sure at this point because you need to make further decisions, it's still to your advantage to get information now about preparation--it will only help you in the future and perhaps make your path easier.

Please contact me for more assistance.  I have 25 years experience working with both buyers and sellers.

Julia Huntsman, REALTOR, Broker | www.juliahuntsman.com | 562-896-2609 | California Lic. #01188996

11/27/2019

Are Long Term Homeowners Staying in Their Homes Just To Spite Their Kids?


The baby boomer generation takes a certain amount of flak for not moving on and selling their current home that they've lived in for so many years, and the younger generations equally so for supposedly not being interested in buying.  Lowest mortage rates still do not seem to be incentive enough for bringing buyers off the shelf. There's a lot of labeling that goes on as people search for answers, and a lot of misinformation and misunderstanding.  The economics of the housing market is a compilation of factors over time, and doesn't amount to just any one thing, like being too selfish to sell, or too disinterested in buying. Tax issues, for example, are putting a squeeze on long term owners, known as the SALT cap, mixed with being faced with being forced to move up to higher prices in California, if they stay here. For these and other reasons, the fact is that owners are staying put about twice as long as the average stay about 15 years ago.
And, there's even a current projection now, that in spite of the long term squeeze on inventory, the future may bring so many houses on the market from the baby boomer generation that there may not be enough buyers from the later generations to take up the slack.

For sellers who do decide to sell, and find a less expensive market to move to, it's wise to be practical in pricing.  Still, home sales in California continue to show mild growth overall, since mortgage rates continue to be favorable for buyers.

If you are interested in finding your home's value, please contact me.  I have been helping buyers and sellers achieve their goals since 1994.

Julia Huntsman, REALTOR, Broker | www.juliahuntsman.com | 562-896-2609 | California Lic. #01188996

2/10/2017

Housing Market and Inventory Shortage in Los Angeles County

Buyers still experience a great deal of competition when submitting offers. I know of one recent instance where an offer for a $450,000 house was submitted at $10,000 over asking, but the buyers were still outbid. This is and has been a very frustrating fact of life for quite some time.

 As it happens, Los Angeles County has far more jobs than new housing permits issued compared to any other county in California. Santa Clara and Orange Counties are the next most underbuilt counties. This did not happen overnight, but happened over several years, and estimates are that it will take several more years to "catch up".

 Other reasons for low inventory is that the Baby Boomer generation and/or longtime homeowners are not moving as much as in the past. The recession featured very low interest rates, or they may have lower property taxes, or if they move there may be a capital gains hit due to rise in prices ($250,000 for single, $500,000 for couple), there is the question of where can they move to, or their circumstances may have changed and they cannot qualify for the same mortgage today--so they stay put.

In California in the 1970s, there was about a 9% turnover rate, in 2014 that rate had declined to less than 5%. In 2000, California sellers stayed put for about 6 years (national average was about 7 years); as of 2016, that average length of stay was 10 years. Californians 55+ years of age are now at their lowest rate of moving -- 71% of the 55+ crowd has not moved since 1999. Data from the construction industry reveals $3.9 billion was invested in remodels and additions compared to $1.5 billion in 1988. In San Francisco alone, there are currently between 400,000 and 700,000 rentals that used to be owner-occupied, in other words, those are properties taken out of the purchase market. Another interesting effect is formulation of households -- not as many people getting married and wanting to buy a new home for a new family! Additional effects on the housing market could be future policy changes concerning the mortgage interest deduction and outmigration to more affordable areas (which at least might put some properties on the market).
Political uncertainties and Twitter bursts are essentially wildcards for certain aspects of the housing market.
 For buyers, is it impossible?  No, but it's extremely important to be prepared with local market knowledge, and prior loan approval before shopping.

1/19/2017

Here Are 5 Good Reasons to List Now


Have you thought about selling your investment or residential property over the last five years? Here are five reasons now may be the time.
1. We are experiencing selling price increases, so the market may be much different now compared to when your property was last for sale. Here are some statistics, according to California Regional Multiple Listing Service data: Long Beach average home prices rose by 6.6 percent, and the median home price rose 8 percent, over the last 12 months through December 2016. The California home price average is expected to increase by 4.6 percent in 2017.
2. The inventory of available homes for sale continues to decrease from what it was just one year ago, making the competition among sellers considerably lower. The local market as of December is at 1.6 months or less of inventory (6 months is the traditional norm). 
3. Mortgage interest rates are still at record lows, in December only slightly higher than the lowest of all rates which was also in 2016, making homeownership more affordable and bringing new buyers into the market. And where are sellers moving to? There were over 24,000 sales in the top 50 master-planned communities in the country in 2016, an increase over 2015.
4. Rental rates are still rising dramatically for tenants. And if you bought a rental property after 2008-2010, you probably have some price increase in case you're thinking of a 1031 exchange.
5. While we cannot predict the affordability of the 2017 market completely, more millennial buyers (under 34 years) and buyers returning to the market from years of renting are entering the homebuying market. I handle the headache and also work closely with clients in selling homes for out-of-state owners. You can even leave your tenant in the home in many cases.
Contact me for a free valuation of your property or to find out what makes me different from my competition.
Web Statistics