Showing posts with label Orange County. Show all posts

11/01/2021

Average Selling Prices for Long Beach, Lakewood, Cerritos, Huntington Beach plus 4 Counties, October 2021


 All these average prices are for single family homes for the month of October, 2021, based on data from CRMLS Infosparks:

Graph also includes Riverside County.  As the market moves increasingly towards the "luxury" market (home prices over $1,000,000), what will happen to average prices in the lower priced areas?  Already San Bernardino has risen from an average price of about $350,000 in 2019 to over $500,000--the average home price for Los Angeles County as a whole exceeds the average for the entire local MLS system (CRMLS).  Average days on market is well under 30 days for these figures.


October, 2021
Long Beach
 $926,773                 Avg Days on Market :20
Lakewood
$774,909                  Avg Days on Market :14
Cerritos
$1,034,148               Avg Days on Market :15
Huntington Beach
$1,372,754               Avg Days on Market :18
Cypress
$1,026,296               Avg Days on Market: 12
Los Alamitos
$1,129,167               Avg Days on Market: 14 
 
Los Angeles County
$1,309,422 (4th highest average price in last 5 years, all in 2021)
San Bernardino County
$529,915   (2nd highest average price in last 5 years)
Orange County
$1,518,637 (2nd highest average price in last 5 years)


 For a market evaluation of your property (house, condo, multiple units), please contact me or go directly to my website for your own automated estimate delivered directly to your inbox.


Julia Huntsman, REALTOR, Broker | www.juliahuntsman.com | 562-896-2609 | California Lic. #01188996

8/21/2020

Infographics on Los Angeles and Orange County Housing Reports for July 2020

 For Orange County, existing house sales were up in July from last year, but in Los Angeles County sales were down by about the same amount.  In both counties, the number of active listings was down over 40% from last year.  And in both counties the median price increased over 4% and 6% from July, 2019.  

What is driving the upward price trend?  Lower inventory and continuing buyer demand for homes.


Julia Huntsman, REALTOR, Broker | www.juliahuntsman.com | 562-896-2609 | California Lic. #01188996

1/24/2020

2019 End of Year Single Family Home Activity for Los Angeles and Orange Counties

Los Angeles County 2019 Review for SFR

The thing to remember about statistics showing data drawn from December to December (as these diagrams show) is that the market is usually slower, lower, etc., at the end of the year compared to the middle of the year, so comparisons from December to the following August could show a little differently.

Sales volume is up in Los Angeles County, while the number of active listings is down, but the median and average home prices continue up--meaning that there's decreasing inventory with sales prices driven upward.

Closed Volume
  $7,812,678,480 | +27.4%;
Average Price
  $1,004,807 | +9.4%;
Active Listings:
  7,787 | -35.1%; (13,579 in June)


Orange County 2019 Review for SFR
In the meantime, in Orange County, sales volume is also up percentage wise, but the total dollar amount is approximately half of Los Angeles County (OC is about one-third the population of LA County).  The average single family home price compare in both counties.


Closed Volume
  $3,307,614,666 | +36.5%
Average Price
  $1,092,343 | +1.9%
Active Listings
  2,963 | -34.6%  (5,846 in June) 

Take note:  In both counties, months supply of inventory dropped over 35%, to less than 2 months, and at the peak in May, inventory supply was not over 4 months supply.  In both counties, houses sold within 2% of the original asking price, so overall housing market prices are holding steadily.

For an evaluation of your home, condo, or residential unit property, please contact me by phone, email or text for for information on your property.

Data provided by InfoSparks, CRMLS.

Julia Huntsman, REALTOR, Broker | www.juliahuntsman.com | 562-896-2609 | California Lic. #01188996

12/03/2019

Market Prices for November in Long Beach, Huntington Beach, Lakewood, Cerritos, plus Three Counties

Looking for Remodel ideas?
All these prices are for the month of November, 2019, based on data from CRMLS Infosparks:

Average prices for single family homes in Orange County are still showing a slow downward trend since May, 2019, while Los Angeles County is still up from earlier in 2019, and San Bernardino County's average is continuing to the highest average in the last 5 years! This is a buying opportunity for many right now.

The average days on market for the four cities is between about 20 and 50 days.  However, in the very high end markets in Long Beach, properties over $1 million are now generally on the market longer than those under $1 million.  In comparison, prices for the 236 actively listed Long Beach houses under $1 million are currently at 49 average days on market at an average list price of $657,000.  More buyer opportunity in this range!

Luxury Market:

There are currently 68 active single family homes (as of 12/3) listed over $1,000,000 in Long Beach, the average days on market is currently 91.  There are currently 36 properties in escrow, average of 104 days on market.  If you have a listing over $1,000,000, it might be taking a little longer to sell than earlier in the year, but also not unusual for this time of year.

Average single family home prices vary according to area, and here's what they look like locally:

November, 2019
Long Beach
$734,340 (down from October)       Avg Days on Market :18 (down from Oct.)
Lakewood
$606,335 (down from October)       Avg Days on Market : 22 (down from Oct.)
Cerritos
$811,173 (up from October)            Avg Days on Market :39 (up from Oct, down from July)
Huntington Beach
$1,143,086 (down from 18 month high)   Avg Days on Market : 50 (highest since Feb. 2019)
Los Angeles County
$955,098 (down from July and October)  Avg Days on Market : 37
San Bernardino County
$383, 071 (September was highest avg of last 5 years at $392,195)  Avg DOM : 27 (down from Feb.)
Orange County
$1,040,012 (down from May)                  Avg Days on Market : 29 (up from May)

The above prices are for single family homes, please contact me for condo market prices!

The graphic above may give ideas on remodel projects if you're thinking of selling.

Julia Huntsman, REALTOR, Broker | www.juliahuntsman.com | 562-896-2609 | California Lic. #01188996

5/11/2019

Average Selling Prices for June, 2019 in Long Beach,Lakewood, Cerritos, Huntington Beach and Three Counties

View of downtown Long Beach
All these prices are for the month of June, 2019, based on data from CRMLS Infosparks:

Average prices for single family homes in Orange County were showing a slow downward trend since early 2018 but shot upward in May of this year, while Los Angeles County is trending up from $919,000 in December 2018, and San Bernardino County's average is now up the highest in the last 18 months as homeowners and investors find buying opportunity there.
The average days on market for the four cities is about the same as before.  However, in the very high end markets in Long Beach, properties over $1 million are generally on the market longer than those under $1 million.
Average single family home prices vary according to area, and here's what they look like locally:

June, 2019
Long Beach
 $661,746                 Avg Days on Market :34
Lakewood
$603,745                  Avg Days on Market : 28
Cerritos
$728,655                  Avg Days on Market :42
Huntington Beach
$1,014,446 (18 month high)   Avg Days on Market :40
Los Angeles County
$966,765 (still down from a high in May, 2018)
San Bernardino County
$377,714(highest average price in last 18 months)
Orange County
$1,087,04 (down slightly from May 2019 18-month high)


For condo prices, please contact me!

For an online and automated home valuation, try my site at http://www.juliahuntsman.com/home-evaluation.  It probably works more accurately for single family homes than condos in some areas, depending on what properties lie within about a one-mile radius.  Try it!  And I am always happy to do a more customized report to send out via e-mail.  If you're thinking about making a move, do it! It pays to keep an eye on things.


Julia Huntsman, REALTOR, Broker | www.juliahuntsman.com | 562-896-2609 | California Lic. #01188996

3/05/2019

Housing Market Review, Fewer Sales and More Listings on the Market

Sales volume down in So Calif
As one can see from the slide (presented at 2/27/19 talk by Joel Singer, CEO of California Association of Realtors) to the right, sales volume locally (and elsewhere) is down, and has been for some time--since April of 2008.

Another example of reduced 2018-2019 sales volume in Los Angeles and Orange Counties are in the two charts showing reduction by about 37% compared to January 2018 in LA; reduction by about 35% in OC. The median price for OC home declined $35,000--median price in LA stayed the same. INTERESTING!!


Sales volume change in Los Angeles County
Sales volume change in Orange County


In Long Beach, sales volume decreased about 5% in one year. The City of Orange had a 12% decrease in sales. But year-over-year median price home prices increased in Yorba Linda, Norwalk, Garden Grove, and elsewhere, whereas Long Beach/Lakewood have decreased by lesser amounts in price.

The essential points presented last week were:
"• Housing market conditions continue to soften | • Sales down double-digits despite recent decline in interest rates | • Price growth remains near lowest level since early 2012 | • Fundamentals are still solid | Window of opportunities for buyers"

The good news for buyers is that inventory statewide is the highest in almost 3 years.  Buyers and sellers have become so accustomed to a history of lowered inventory, it's time to be reminded that a normal market is about 6 months of inventory--we're still not there! The lowest price segment of $200,000 and lower has not seen an increase, however, and many buyers need that price point.  Long Beach in February, for example, had 2.5 months of inventory for single family homes, and that was a 38% increase over one year ago. We still need more units on the market.  The biggest recent increase of active listings on the market is in the Bay Area, 57% higher than last year.

Advice for sellers is to be reasonable in your asking prices, it's still a very good time to sell.  Buyers may take some encouragement as the inventory comes up!


Julia Huntsman, REALTOR, Broker | www.juliahuntsman.com | 562-896-2609 | California Lic. #01188996

1/25/2019

Sales Volume, But Not Price, Down in Los Angeles and Orange Counties in 2018


Los Angeles County Median Sales
 One of the most immediately noticeable things about the two charts is the decline in number of sales in both Los Angeles County and Orange County in 2018 compared to 2017. 
LA County sales for both single family homes and condominiums declined about 40 percent in 2018, and the same for Orange County.

Yet the median sales prices increased.

 The price increase is also predicted for 2019, at a lower rate in some price categories.  The market under $600,000 continues to be the most competitive and sells more quickly.

Interest rate hikes are likely to be left alone for a while, and the Mortgage Bankers Association currently reports the highest level of mortgage applications since 2010.

In the continuing competitive real estate environment, buyers must be totally prepared with a complete loan pre-approval from a qualified lender, while sellers are advised to be realistic in pricing of properties.
 
Orange County Median Sales


Julia Huntsman, REALTOR, Broker | www.juliahuntsman.com | 562-896-2609 | California Lic. #01188996

1/09/2019

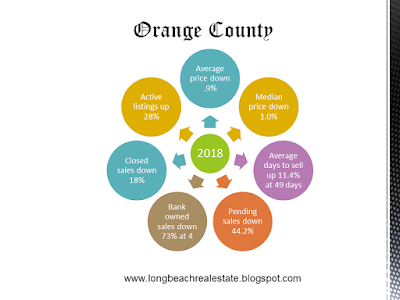
Orange County, 2018 Year in Review

Orange County single family homes 2018
OC Single Family Homes 2018


This chart is only for single family homes in Orange County, no condominiums are included. 

This is the overall picture from December 2017 to December 2018; the market in the OC had higher peaks during the summer and fall.  Overall, however, the lower number of pending sales, meaning fewer properties are in escrow, is much less than one year ago and has been on a steady decline since a peak month in May, 2018.
Sales prices overall have not changed significantly, and it's still a good time for sellers to put their properties on the market.

For a confidential valuation of your property, please contact me.  I make it easy for you to get decisive information about putting your property on the market.


Julia Huntsman, REALTOR, Broker | www.juliahuntsman.com | 562-896-2609 | California Lic. #01188996

5/21/2018

Average Selling Prices in Long Beach, Cerritos, Lakewood, and Local Counties, April 2018


https://blogger.googleusercontent.com/img/b/R29vZ2xl/AVvXsEiyVR0acogENReo66uCkPnpgHBderKoXmlKVewPviWDorCXaB5p4AlRpAfiqel37P2PG72ksE9ai7tvwgJE8fgdEJsgnge-T_p-N_MebUl-j3J2SeCM1U-rp5oS0fMK-1sV3yRaKA/s1600/Ireland+2010+059.jpgFor a single family detached home, the average prices for the cities and counties below range from $381,718  to $1,141,966, the low price being in San Bernardino County.


Overall the Los Angeles County average price for single family home is $992,808, a small increase from the previous month of $969,831, and now exceeding the high of July 2017.

All these prices are for the month of April, 2018, based on data from CRMLS Infosparks.

Long Beach average price is slightly decreased from the prior month, but Orange County has surpassed the high of May, 2017, while Los Angeles County as a whole is now above the high of $955,973 in July 2017.  San Bernardino County's averages also exceed the earlier highs of $360,000, and is now at the the highest point in the last 5 years. Average single family home Pprices are varying according to area, and here's what they look like locally.

April 2018
Long Beach
$685,445 | -4.1%
Lakewood
$600,580 | +8.2%
Cerritos
859,816 | +5.2%
Los Angeles County
$992,808 | +9.0%
San Bernardino County
$381,718 | +11.2%
Orange County
$1,141,966 | +14.2%
These statistics show a mix of pricing, with Long Beach at an average days on market at 28 days, Lakewood at 24 days on market, and Cerritos at 34 days on the market on average.  Inventory is still at 2 months or less in all 3 cities, and closing prices continue within 1.5% over or under the original price.  In other words, since the last analysis in November 2017, houses are still selling within 2% of original list price, with less time on the market, and a low housing inventory from which to choose.   
Condos
Briefly, Long Beach condo average price is $395,639, a decrease from $437,000 last month. The condo average for Los Angeles County is $602,193, a slight decrease from last month. Other local city condo prices: Cerritos: $370,000;  Monterey Park, $439,500; Pasadena, $715,634; Whittier, $353,692.
 It’s a tight market right now!
For an online and automated home valuation, try my site at http://www.juliahuntsman.com/home-evaluation.  It probably works more accurately for single family homes than condos in some areas, depending on what properties lie within about a one-mile radius.  Try it!  And I am always happy to do a more customized report to send out via e-mail.  If you're thinking about making a move, do it! It pays to keep an eye on things.

P.S. The photo is a door in Dublin, Ireland, where the housing market is pretty similar to our West Coast!
Julia Huntsman, Broker Realtor

Lic 01188996
www.juliahuntsman.com

12/20/2017

Average Selling Prices in Long Beach, Cerritos, Lakewood, and Local Counties, November 2017


It's that time of the year, where housing often slows down for the holidays, but here it's spending less time on the market.
For a single family detached home, the average prices for the cities and counties below range from $357,823  to $1,052,160, the low being San Bernardino County.

Overall the Los Angeles County average price for single family home is $923,612, a small increase from the previous month of $910,161, and still under the high of July 2017.

All these prices are for the month of November, 2017, based on data from CRMLS Infosparks.

Long Beach saw an average price decrease (but up from October), and Orange County is still  down just slightly from the high of May, 2017, while Los Angeles County as a whole is still decreased from the high of $955,973 in July.  San Bernardino County's averages have dipped under earlier highs of $360,000, the highest point in the last 5 years.
Prices are varying according to area, and here's what they look like locally.

November 2017
Long Beach
$667,858 | -0.7%
Lakewood
$570,839 | +2.8%
Cerritos
$776,412 | +9.9%
Los Angeles County
$923,612 | +5.3%
San Bernardino County
$357,823 | +5.3%
Orange County
$1,052,160  | +12.8%

These statistics show a mix of pricing, with Long Beach/Lakewood  with average days on market at 18 days, and Cerritos having less than 24 days on the market on average, less than 2 months inventory, and closing prices continuing within 0.7%-1.5% of original price.  In other words, houses are selling within 2% of original list price, with less time on the market, with a low housing inventory from which to choose.   
Condos
Briefly, Long Beach condo average price is $383,921, down from over $400,000 the month before. The condo average for Los Angeles County is $608,000. Other local city condo prices:  Monterey Park, $425,800; Pasadena, $713,622; Whittier, $353,692.
 It’s a tight market right now!
For an online and automated home valuation, try my site at http://www.juliahuntsman.com/home-evaluation.  It probably works more accurately for single family homes than condos in some areas, depending on what properties lie within about a one-mile radius.  Try it!  And I am always happy to do a more customized report to send out via e-mail.  If you're thinking about making a move, do it! It pays to keep an eye on things.


11/20/2017

Average Selling Prices in Long Beach, Cerritos, Lakewood, and Local Counties, October 2017


Prices are varying according to area, and here's what they look like locally.
For a single family detached home, the average prices for the cities and counties below range from $364,271 to $1,052,322.

Overall the Los Angeles County average price for single family home is $903,618, a decrease from the previous month of $925,566, and even lower from July 2017.

All these prices are for the month of October, 2017, based on data from CRMLS.

Long Beach saw an average price decrease, and Orange County is still up slightly from July 2017, while Los Angeles County as a whole is still decreased from the high of $955,973 in July.  San Bernardino County's averages in September and October are now over $360,000, the highest point in the last 5 years.

October 2017
Long Beach
$646,002 | +5.3%
Lakewood
$558,111 | +1.8%
Cerritos
$795,732 | +17.9%
Los Angeles County
$903,618 | +3.9%
San Bernardino County
$364,271 | +6.9%
Orange County
$
1,052,322 | +9.6%

These statistics show a mix of pricing, with Long Beach/Lakewood and Cerritos having less than 43 days on the market on average, approximately 2 months inventory, and closing prices continuing within 1%-2% of original price.

Keeping an eye on things
For an online and automated home valuation, try my site at http://www.juliahuntsman.com/home-evaluation.  It probably works more accurately for single family homes than condos in some areas, depending on what properties lie within about a one-mile radius.  Try it!  And I am always happy to do a more customized report to send out via e-mail.  If you're thinking about making a move, do it! It pays to keep an eye on things.


9/30/2017

Average Selling Prices in Long Beach, Cerritos, Lakewood, and Orange County, August 2017


Prices are still going up, and here's what they look like locally.
For a single family detached home, the average prices in this group range from $579,687 to $1,019,768.

Overall the Los Angeles County average price for single family home is $905,787, a decrease from the previous month of $955,973.

All these prices are for the month of August, 2017, based on data from CRMLS.

Both Long Beach and Lakewood saw average price decreases from July, and Orange County is up slightly from July 2017, while Los Angeles County as a whole decreased from August's $955,973 in July.  San Bernardino County average has increased slightly since July, still under $360,000.

August 2017
Long Beach
$686,728 | +8.4%
Lakewood
$579,687 | +9.1%
Cerritos
$773,835 | +9.1%
Los Angeles County
$905,787 | +5.4%
San Bernardino County
$357,482 | +7.0%
Orange County
$
1,019,768 | +4.9%

This statistic show a mix of pricing, with Long Beach/Lakewood and Cerritos having less than 30 days on the market on average, approximately 2 months inventory, and closing within 1-2% of original price.

Keeping an eye on things
For an online and automated home valuation, try my site at http://www.juliahuntsman.com/home-evaluation.  It probably works more accurately for single family homes than condos in some areas, depending on what properties lie within about a one-mile radius.  Try it!  And I am always happy to do a more customized report to send out via e-mail.  If you're thinking about making a move, do it! It pays to keep an eye on things.


8/21/2017

Average Selling Prices in Long Beach, Cerritos, Lakewood, and Orange County, July 2017


Prices are still going up, and here's what they look like locally.

For a single family detached home, the average prices in this group range from $586,928 to $1,003,739, which represent increases between 1.3%-13.2% over June prices.

Overall the Los Angeles County average price for single family home is $956,939, an increase from the previous month (the median price is $610,000 for July).

All these prices are for the month of July, 2017, based on data from CRMLS.

Orange County as a whole has slowed to just over 1.3% from last month while Los Angeles County as a whole increased over 11% in July.  The areas with more lower priced homes (relatively speaking) are seeing bigger increases than Orange County, with overall higher priced homes, with a smaller percentage increase.
July 2017
Long Beach
$705,682 | +13.2%
Lakewood
$586,928 | +12.1%
Cerritos
$757,438 | +4.5%
Los Angeles County
$956,939 | +11.0%
San Bernardino County
$355,603 | +3.1%
Orange County
$1,003,739 | +1.3%

How much higher will things go?  Unknown, but as long as the interest rates are lower, and buyers are able to find sources for down payment funds, the end is not in sight according to many market experts.
If a buyer were interested in the average selling price of $350,000 for a house, then San Bernardino County (average at $355,000 in July) and the Inland Empire would be the place to search in Southern California, and Northern California in many counties, excluding the Bay Area, would hold some similar opportunities.

For an online and automated home valuation, try my site at http://www.juliahuntsman.com/home-evaluation.  It probably works more accurately for single family homes than condos in some areas, depending on what properties lie within about a one-mile radius.  Try it!  And I am always happy to do a more customized report to send out via e-mail.  If you're thinking about making a move, do it! The future is yours.

7/26/2017

Average Selling Prices in Long Beach, Cerritos, Lakewood, and Orange County, June 2017

Average Sales Prices chartLong Beach, Cerritos, Lakewood, Orange County prices
Prices are going up, and here's what they look like locally.  For a single family detached home, the average prices in this group range from $575,786 to $770,826, and for overall comparison to Orange County at over $1 million, they're obviously somewhat lower.  Overall Los Angeles County average price is $918,450 (the median price is $632,000 for June).  All these prices are for the month of June, 2017, based on data from CRMLS

One characteristic to note is that Orange County as a whole has increased just over 4%, Los Angeles County has a whole has increased over 9% in June.  The areas with more lower priced homes (relatively speaking) are seeing bigger increases than Orange County, with overall higher priced homes, with a smaller percentage increase.
How much higher will things go?  Unknown, but as long as the interest rates are lower, and buyers are able to find sources for down payment funds, the end is not in sight according to many market experts. The Federal Reserve, however, is expected to raise rates one more time this year.
"But while interest rates will increase to an estimated 5% by the end of 2018 and 6% by the end of 2019, most economists expect home price growth will also slow to between 2% and 4% once rates begin to rise."
If a buyer were interested in the average selling price of $350,000 for a house, then San Bernardino County and the Inland Empire would be the place to search in Southern California, and Northern California in many counties, excluding the Bay Area, would hold some similar opportunities.

For an online and automated home valuation, try my site at http://www.juliahuntsman.com/home-evaluation.  It probably works more accurately for single family homes than condos in some areas, depending on what properties lie within about a one-mile radius.  Try it!  And I am always happy to do a more customized report to send out via e-mail.  If you're thinking about making a move, do something besides stare.

Cat, Funny, Goofy Face, Animal, Cute, Pet, Feline

7/22/2013

California County Tax Assessors Are Sending Notices About Property Tax Increases

Do you know about the increase of impending property tax assessments?

A precedent setting California court case allows county assessors to recapture tax cuts as real estate values recover their losses.

Citing a practice called “value restoration” or recapture”, County Assessor's offices throughout the state are sending out notices this week.

County Assessor's offices say they can raise taxes by more than Proposition 13's two percent limit when home prices rebound for properties that had prior assessment reduction; plus two percent each  year for every year they‘ve owned the property.

Many homeowners who got tax cuts during the recession will see their taxable values rise as much as seventeen percent this year.

The California Supreme Court affirmed assessors' right to do this after Seal Beach lawyer Robert Pool lost his court fight to block the Los Angeles County Assessor (and all California assessors) from recapturing lost assessment values after the 1990s housing market crash.

This week 31,803 Orange County homeowners face that same shock via a “blue notice” in the mail.

The Assessor's Office must notify property owners by mail by July 20th. 

Property owners have until Sept. 16, 2013 to file an appeal with the Clerk of the Board of Supervisors. 

12/03/2012

What is For Sale Under $300,000 in Long Beach?

MLS R1205418 - Click to see listing
Periodically (maybe once a year) I've been tracking this price range about affordable properties in Long Beach. 
One thing to know since my last post on this subject in May, 2012:  The market has changed, and for more than one reason.  Not only are prices going up in some areas, but at the same time there is far less inventory than even just a few months ago. 

Currently, in the MLS, the total number of active listings for $300,000 or less for single family homes, condominiums, lofts, own-your-owns, and coops comes to the grand total of 167 as of this date.  Compare that to 618 properties in May of 2011.
 
The breakdown is as follows:
  • Single family homes (some of which homeowner association listings in PUDs) comprise 62;
  • There are 80 condominiums listed;
  • There are 7 coops (similar to condos but have different property tax arrangements)
  • No lofts in this price range;
  • There are 18 own-your-owns listed (also similar to condos but different property tax mode)
The number of listings is down due to various market forces, not the least of which is fewer distressed properties on the market. In general, market inventory has decreased by 60-75% since this time last year.  Also, the market prices are actually increasing compared to October of 2011, sometimes by as much as 20% on a month/year to month/year comparison in some zip codes of Long Beach.  See a south Los Angeles County/north Orange County regional report for overall market trends for areas including Lakewood, Cerritos, Huntington Beach, Newport Beach and inland cities including Fullerton.  While the picture may vary individually within each city or zip code, the trends are reported here.

There are even more complex trends within the picture presented here, such as the future of the mortgage debt relief  forgiveness being uncertain which is probably impacting some short sale sellers from putting their property on the market, whether or not there is "shadow inventory" which will be added to the market in 2013 (that's another topic of discussion).

For a property search of these areas go this property search tab, where all types of properties, including 2,3, and 4 units, may be searched throughout Long Beach, Los Angeles County and Orange County and all cities in Southern California. (Currently, all active, backup and pending status listings are shown in this search.)

Are you thinking of selling? Please contact me.

9/27/2012

Los Angeles and Orange Counties Home Price Snapshot

Orange County's median single family home price was Orange County $567,710 in August 2012, up from $551,160 in July 2012, and up from $508,910 in August 2011.

Median price of a single family home in Los Angeles County was $344,770 in August 2012, up from $334,190 in July 2012, and up from $312,900 in August 2011.

6/15/2010

Price and Value -- It's Increasing for Southern California Lately

The buyers' tax credit had an effect: There were more sales. And the low mortgage rates are helping (below 5% with paying one point). Per Dataquick, May sales of houses and condos in Southern California were the highest since May 2006: "...what we saw in May was partly driven by government stimulus".  May's typical monthly mortgage on new purchases was approximately $1293 -- do you remember when it was about $2200?--but that's still an increase from 2 years ago. Home flipping is trending higher--current rules require an investor to wait 90 days. Sales volume is up in Los Angeles and Orange Counties in this category, and so is the median price: $345,000 and $450,000. Although houses and condos cannot be compared across the board in all ways, nor can all geographic areas, this seems to be an overall general trend in price and sales. And, buyers who paid all cash account for over 24% of May sales. That's 10% higher than the 23-year monthly average.  This is not news to those buyers who have submitted offer after offer and continually lose out in the median price range. Will this trend hold, and how much had to do with the tax credit, which ended April 30th?
California Association of Realtors reports that April sales (May's report not out yet) for single family homes statewide increased 21% over previous April, to $306,230, but sales volume decreased statewide by 8.1% from prior April for SFRs. From C.A.R. on May 24th, "Large changes in local median home prices typically indicate both local home price appreciation, and often, large shifts in the composition of housing market activity. Some of the variations in median home prices for April may be exaggerated due to compositional changes in housing demand." So, in other words, real estate is local.

4/25/2008

Orange County Sales Are Moving Up

Is 23% the critical number for Orange County sales? Yesterday I got all excited about an Orange County Register article by Jonathan Lansner entitled "Homebuying demand jumps 23%, expert says: Wave of first-time buyers causes number of properties in escrow to soar vs. a year ago" and went looking for the link online. Had a hard time finding that article online, but found this byline about LA/OC home prices by Mr. Lansner as being down 23% this year. In spite of that, here's a quote from the article,
"Demand for Orange County housing is growing, according to Steve Thomas at Re/Max Real Estate Services in Aliso Viejo. As of Thursday, 2,374 houses and condominiums had gone into escxrow in the past 30 days, a 23 percent gain vs. a year ago."

Market absorption time is reportedly 6.55 months at the current rate if all properties currently in escrow are sold, a much shorter period of time than 10-11 months inventory supply in other markets.

If anyone finds the online article, please let me know!

'Voice this!
Web Statistics