Showing posts with label Cerritos. Show all posts

3/22/2016

February Home Prices in the Long Beach Area for February 2016

February 2016 Los Angeles County Sales
Why the sluggishness in sales?  The ripple down from the top tier of sales is being felt:  "In markets like Oakland, Portland and Washington, the prices for high-end homes are rapidly rising — the rungs of the ladder are moving further apart — and that makes it harder for people who own mid-tier homes to trade up. And when they get stuck, people who own starter homes have a harder time trading up, too."  http://preview.tinyurl.com/gpdc3lj  San Francisco could easily be mentioned too.

It's always speculated in an election year that sales are affected, but it is more likely due to higher prices and lower affordability overall.  

In Los Angeles County, the median priced home in February, 2016 was $530,000 (up from $457,870 in January, 2016), and condos were at $450,000, (up from $409,000 in January, 2016). However, the February sales volume for each type was less than half of the prior year volume, and well below January sales numbers.

Below are average prices for Cerritos, Long Beach, Lakewood , and Seal Beach single family homes.  The four cities have changed between -1.8% to 14% from January.  Current average price - Long Beach $637,112; Cerritos - $682,431; Lakewood $4501,775; Seal Beach $1,066,938.

Average condominium prices increased only in Long Beach, by 22.8%, and are ranging from $237,666 (Cerritos) to $289,667 (Seal Beach), $292,500 (Lakewood) and $379,522 (Long Beach).

While there is an increase in Long Beach average home price, it has the advantage of offering greater types and prices in the housing market compared to surrounding cities.  Still a good time to buy with lower interest rates!

1/22/2016

December Average Sold Prices in Cerritos, Long Beach, Lakewood and Seal Beach

In Los Angeles County, the median priced home in November 2015 was $457,870 and $489,310 in December, 2015 for all of California.

In the chart below are average prices for Cerritos, Long Beach, Lakewood , and Seal Beach single family homes for the past 2 years through December 2015.  The four cities have increased between 12% and 20% in that time.  Current average price - Long Beach $611,735; Cerritos - $699,438; Lakewood $529,903; Seal Beach $1,070,400.


Average condominium prices are more similar for all four cities, ranging from $383,000 (Cerritos) to $312,000 (Seal Beach).

9/02/2015

Prices in Long Beach, Lakewood, Cerritos, Signal Hill

Home prices continue to rise in Los Angeles and Orange Counties, 6% to June of this year from June of last year according to the Los Angeles Times.  In the four cities below, the average days on market for a single family home in August ranges from 41 days (Lakewood) to 67 days (Signal Hill). Long Beach had total closings of 193 (not surprising since it's the largest city of the four), Signal Hill had 6 closed sales, Cerritos had 26 sales, and Lakewood had 72 sales.

Even though the National Association of Realtors® reported that sales in July were the highest since 2007, Long Beach and Cerritos sales volume decreased somewhat in August.

Housing inventory is still low, although a recent daily trend for the local market shows a higher number of new listings in the MLS than closed sales. For August, however, each of the four cities below shows a decrease in inventory supply from the prior month: 1.6 months (Lakewood) being the lowest, and 3.7 months (Signal Hill) being the highest. Long Beach had 2.2 months supply in August. The traditional norm for a normal market supply has been 6 months.  This is a long term trend: Prices go up while inventory remains low.

Condo prices, which are typically lower than single family home prices, also increased from the prior month: average prices in Lakewood -- $485,000; Signal Hill -- $379,000; Long Beach -- $362,000; Cerritos -- $392,000; all prices represent increases from prior month range from 2% (Signal Hill) to 60% (Lakewood).

4/16/2015

Market Stats for 1st Quarter, Long Beach CA and Nearby Cities


Not surprisingly, with the low low interest rates, prices have climbed especially with single family homes.  Condo prices have varied, and do vary by zip code, especially in Long Beach where completely different areas have their own pricing.  All median prices in the chart below are for cities regardless of specific areas, and this chart is meant to show an overall trend for the 1st quarter of 2015:

MEDIAN SALES PRICES1/1/20153/1/2015
Long Beach Single Family$482,500$540,000
Long Beach Condo$310,000$275,000
Long Beach Multi-Family$599,000$620,000


Lakewood Single Family$443,500$475,000
Lakewood Condon/a$300,005
Lakewood Multi-Family$452,000$579,000


Cerritos Single Family$602,000$638,000
Cerritos Condo$285,000$453,000
Cerritos Multi-Familyn/an/a


Bellflower Single Family$418,000$395,000
Bellflower Condo$300,000$280,000
Bellflower Multi-Family$550,000$602,000
Data provided by Market Analyzer

2/12/2015

What is the January 2015 Real Estate Profile of Long Beach, Cerritos, Lakewood and Rossmoor?

Here is a brief summary of January 2015 sales, compared to January 2014:

Long Beach - Median sales price for a single family home: $481,000 (up 5.8%), housing inventory down 22%, with only 2.2 months supply of inventory on the market.

Cerritos - Median sales price for a single family home: $602,000 (up 3%), housing inventory down 9% with only 2.1 month supply of inventory on the market.

Lakewood - Median sales price for a single family home: $443,500 (up 3%), housing inventory down 44%, with 1.4 months supply of inventory on the market.

Rossmoor - Median sales price for a single family home: $807,500 (up from $800,000), housing inventory still at 2.6 months supply of inventory on the market.

By checking points along the graph, prior months' sales prices are seen. Long Beach and Cerritos are down, Lakewood and Rossmoor are up. This is a live graph, and is updated with each month's sales.

Would you like to know what buyers' home buying motivations are? Buyers who purchased brand new homes did so because of fewer electrical and plumbing problems. Sellers who take this and other items into account when preparing their home for sale are less likely to get a laundry list of repairs desired by buyers.
NAR's 2014 Profile of Buyers and Sellers

9/15/2014

What Is The January 2015 Market Doing in Long Beach, Cerritos, Lakewood and Rossmoor?

Here is a brief summary of January 2015 sales, compared to January 2014:

Long Beach - Median sales price for a single family home: $481,000 (up 5.8%), housing inventory down 22%, with only 2.2 months supply of inventory on the market.

Cerritos - Median sales price for a single family home: $602,000 (up 3%), housing inventory down 9% with only 2.1 month supply of inventory on the market.

Lakewood - Median sales price for a single family home: $443,500 (up 3%), housing inventory down 44%, with 1.4 months supply of inventory on the market.

Rossmoor - Median sales price for a single family home: $807,500 (up from $800,000), housing inventory still at 2.6 months supply of inventory on the market.

By checking points along the graph, prior months' sales prices are seen. Long Beach and Cerritos are down, Lakewood and Rossmoor are up. This is a live graph, and is updated with each month's sales.

Would you like to know what buyers" home buying motivations are? Buyers who purchased brand new homes did so because of fewer electrical and plumbing problems. Sellers who take this and other items into account when preparing their home for sale are less likely to get a laundry list of repairs desired by buyers.
NAR's 2014 Profile of Buyers and Sellers

8/05/2014

Prices Continue Up for June in Many Cities, But Sales Volume Way Down


Average single family home prices in June, 2014, and the increase or decrease compared directly to June of one year ago (prices may differ from overall annualized price), plus stats on closed sales and days on market (DOM).  Actual number and percentage of sales are down (see red column), a lot; properties are usually spending more time on the market before going into escrow (last column); and the average house price, on a citywide basis, is higher than one year ago.  The percentage increase in price, however, is lower compared to May's increases, in many areas. (P.S. See my new Metro Summary page for Long Beach region info for July).
     

Cerritos$739,333+10.8%Closed Sales-40%DOM +27.8%


Lakewood$463,096+7%Closed Sales-32%DOM +8%


Long Beach$555,496+17%Closed Sales-28.4%DOM +58%


Los Alamitos$726,667+9%Closed Sales-57%DOM +72%


Seal Beach$1,021,223+14%Closed Sales-20%DOM -33.3%


Signal Hill$655,000+7%Closed Sales-75%DOM +87%


Huntington Beach$920,396+19%Closed Sales-21%DOM +68%


Norwalk$340,943+9%Closed Sales-8%DOM +5%


Downey$444,903+8%Closed Sales-24%DOM +59%  


Garden Grove$503,922+15%       Closed Sales-58%DOM -9%


6/30/2014

So Cal Cities Update - Long Beach Region

Happy 4th of July!


Average single family home prices in May, 2014, and increase/decrease from one year ago (prices may differ from overall annualized price):

Cerritos:                 $644,036, +9%
Lakewood:             $479,462, +10%
Long Beach:           $534,617, +4%
Los Alamitos:         $641,000, -16%
Seal Beach:             $989,577, +20%
Signal Hill:              $630,500, -10%
Huntington Beach:  $849,050, +2%
Norwalk:                 $362,598, +12%
Downey:                 $476,152, +19%
Garden Grove:        $495,475, 14%


5/07/2013

Los Angeles County (South) and North O.C. Tell Interesting Stories Of Prices, Sales and Inventory

The latest market updates for April, 2013, are out for the south Los Angeles County and North Orange County cities--and here is a breakdown of stats for single family homes in local cities (all comparisons are a one-month comparison of April 2013 to April 2012, not on an annual basis):
  • Long Beach  -- New listings are up 4% for April 2013; the median sales price has increased 25% to $440,500 (citywide figures); the average sales price is $495,000, an increase of 27%. Listing inventory has decreased by 62.6%, with 1.4 months of inventory at the end of April.
  • Cerritos -- New listings are up 25% for April 2013; the median sales price has increased 8% to $573,000 (citywide figures); the average sales price is $615,758, an increase of 14%. Listing inventory has decreased by 78%, with 1 month of inventory at the end of April.
  • Lakewood -- New listings are up 8.2% for April 2013; the median sales price has increased 12% to $405,000 (citywide figures); the average sales price is $413,000, an increase of 14%. Listing inventory has decreased by 76%, with .8 months of inventory at the end of April.
  • Signal Hill -- New listings are down 42% for April 2013; the median sales price has increased 18% to $594,750 (citywide figures); the average sales price is $529,875, an increase of 8.8%. Listing inventory has decreased by 77%, with 1.8 months of inventory at the end of April.
The general picture is: prices have gone up, and inventory for all properties (houses and condos) is down compared to last year this time, with the lone exception of Avalon (Catalina Island), where inventory is actually up 17% but the median market price is down 33%.   Areas with the greatest increase in median market price tended to be lower priced areas in the past, and are now attracting buyer attention, Bell Gardens and Stanton being two examples.  Los Alamitos (including Rossmoor area) actually decreased by about 6% in median price.  Long Beach stands out at the top of the list of all area cities for the greatest number of closed sales in April at 324 and the most new listings, followed by Irvine at 264 closed sales, then by Anaheim and Huntington Beach.  Of the 68 cities included in the geographic area, only 4 are showing a decrease in median price!

Do you want to know what's going on in your zip code? It's sometimes a different picture than the surrounding city. Get the picture now by giving me a call or e-mailing me, so that you can stay up with your market.

9/19/2012

Market Update, And More Home Price Directions Are Moving UP

California prices by county
The median price paid for a Southern California home rose to $309,000 in August--that's an overall median for Los Angeles, Riverside, San Diego, Ventura, San Bernardino and Orange counties--that's an increase of 10% compared to August 2011, and the highest median price since August 2008's median of $330,000.

Short sales and foreclosures (the distressed property market) are trending downward by 1%-2% from  July and previous months.  That does not mean they are going away, because the distressed property market is predicted to be here for a long time into the future.  The good news is that higher prices mean a lift out of the short sale category for some prospective sellers, or a higher net from a sale to put towards a new purchase. Short sales in the 6-county area were about 17% of sales, but locally, there are specific areas where they are still 50% or more of the market.

Drops in foreclosure inventory,  increases in sales of higher priced properties are part of the increase in home price.  The increase in numbers of properties in escrow is impacted by the lowest interest rates since the 1940s, which are likely to stay that way for some time into the future, this August was the highest August sales in the last 6 years.  The volume of sales however, is still 15% below the average calculated since 1988.

Investors, or "absentee buyers" bought 27% of the homes last month, and buyers paying with cash were 31%, paying a median amount of $235,000, an increased amount from last year.

Credit conditions for buyers, and therefore for sellers, are strict.  Buyers who currently occupy their homes and want to purchase a new one not only must meet all those loan requirements, but satisfy the lender's requirement for at least 30% equity or more in their property. If your property is currently a rental, the property's equity may not be an issue assuming you have satisfied other lender conditions.

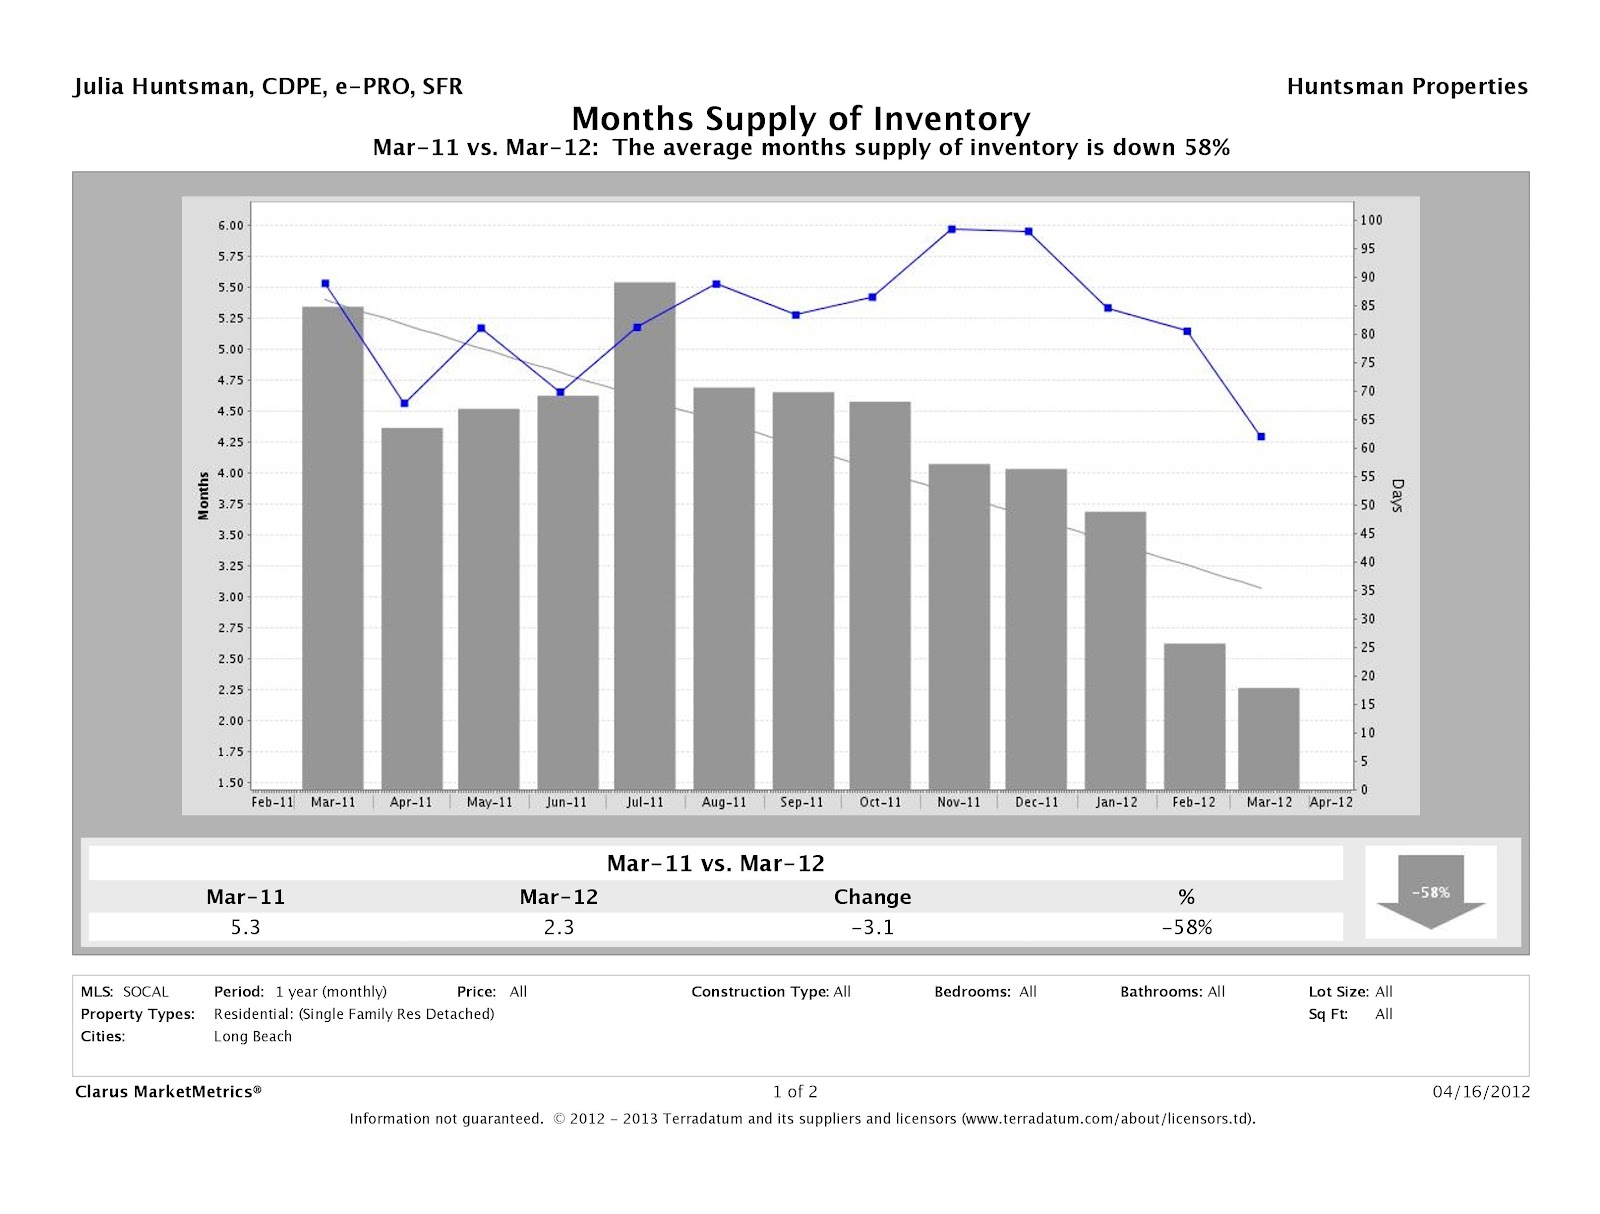
Find more local trends for houses and townhouse/condos in Los Angeles and Orange Counties including housing affordability, months of inventory, median sales price (now up at 5.9% at $450,000 for the region covered by this report), and local inventory amounts. Just go to my site for this local regional report that covers cities including Lakewood, Long Beach, Cerritos, Seal Beach, Huntington Beach, Newport Beach down to Aliso Viejo and Rancho Margarita, out to Yorba Linda and Placentia, and many more cities in between.  A more specific report is available by zip code (here is 90713 in Lakewood) or by city--this one is for Long Beach.
For a copy of your local report, please contact me and I will be happy to send it to you.
Some selected prices:  the highest median sales price in the local region:  Corona del Mar at $1,700,000; Cerritos, $499,900; Long Beach, $320,000; Signal Hill, $410,000; Cypress, $422,500.

Click on the link to see Dataquick's Southern California report for August. Do you want to find out your home's current value?

Please go to What is My Home Worth for more information.

4/16/2012

Long Beach Needs More Single Family Homes on the Market!

Long Beach Inventory
Long Beach--two months inventory
For the last year, since March 2011, the Long Beach median prices have been jumping around.  The median prices for listings and sales have gone up and down for the city, overall. These charts show the overall market, which varies in price quite a bit, and lumps all distressed properties in with regular sales.  In March of last year, the median price was $365,000, and for March of 2012, the price is $369,900--while the "sold" prices have actually gone down. But what is in escrow? That's where the prices in 1-3 months may be showing an upward trend, because sales activity has picked up a much faster pace:  the number of single family properties (both distressed and regular sales) in escrow is up 40%, and is at the highest number in the last 12 months.

Long Beach Median Price march 2012
Median price for listings is up again in Long Beach
And another thing is very clear: in checking with Long Beach, Lakewood and Cerritos, all cities are down to two months or less of inventory for single family houses. The second chart clearly shows a downward trend in numbers of listings on the market since last summer.

That means if no new listings came on the market, the current inventory would be sold in approximately 2 months at the current rate of sale.
Sellers should start contacting their real estate professional now to review their best position for selling, because the buyers, both investor and owner-occupant types, are buying!

I am available to help you as your real estate professional, just give me a call, e-mail me, or contact me through my website at www.juliahuntsman.com.

2/15/2012

Distressed vs. Equity Market in the Long Beach Area

There seems to be a perception (among some people) that high end or "luxury" areas are somehow immune to short sales and foreclosures--but that's not true. The subprime loans, originally targeted for "B" and "C" borrowers, eventually made their way into the "A" borrower range, the borrowers most often buying in the high end price range, because of the tempting terms offered by lenders at the time.  Other factors for distressed sales in those areas are that the accumulated market conditions caused job layoffs or other income reduction, and/or the market value drop caused a short sale or foreclosure in a forced relocation for a borrower otherwise current on mortgage payment. In the high end market areas, many sellers with equity who could not sell simply delayed their plans and took the home off the market if it didn't sell.  But others who needed to sell proceeded with a short sale listing, hoping to find a buyer.

  • For all of 2011, in the 90803 zip code (Naples, Belmont Shore, Bluff Park, Belmont Park, Belmont Heights), approximately 28% of single family homes in the $440,000 to $1.4 million market sold under distressed property conditions. Out of 172 single family home sales listed in the MLS, 47 were designated as a distressed property sale, most of those being short sales.   Condos distressed sales for 2011 were 37 out of 122, or 30% of the condo market in 90803.
  • In the 90814 zip code (Alamitos Heights, and adjacent areas), 34% of single family homes in the $400,000-$900,000 range sold as distressed properties in 2011.

These figures are lower than Long Beach as a whole for 2011, where according to the MLS, 46% of all single family homes sold in Long Beach sold under distressed property conditions.  (These figures for all areas may be lower than the true picture, because some properties are listed as "standard sale" when in fact they are recently foreclosed properties being re-sold by banks which impose their own contract conditions upon the buyer--so they really aren't a standard sales according to standard Realtor contract terms.)


  • In Cerritos, approximately 33% of single family homes listed in the MLS, or 77 out of a total of 231, sold as distressed properties in 2011.
  • Lakewood's distressed single family home sales in 2011 constituted 47% of all single family home sales, comparable to the entire city of Long Beach for distressed home sales.
There really isn't any place that is immune to this category of transaction, certainly not in Southern California. For a consultation about your residential property value, and what you may be able to do, please contact me, or visit my website at www.juliahuntsman.com at "Help for Homeowners".  Don't be one of the potential sellers who does not investigate all options, the bank would really rather have a sold property, a modified loan, a re-finance, rather than a foreclosed property--it helps their values as well.

11/21/2011

Long Beach--and Nearby Cities-- Residential Market Prices and Sales October 2011

Long Beach Harbor view
While prices are dropping overall in the area based on annual figures, condos in zip code 90802 showed a price increase from the prior year of 32.5%; 90803, an increase of 57.9%--and dropped in other reported zip codes (from prior year), per the Los Angeles Times zip code chart for October, 2011. 

Single family home prices in Long Beach dropped by varying percentages from 2.1% (90806) to 24.6% (90804), and based on one house sale in 90802, an increase of over 40% in price from last year.  These prices also vary according to the number of short sales and bank-owned properties in the mix.
Even though decreases are reported here, these are year-to-year, and 2011 month-to-month comparisons may actually show some increases.

October 2011 sales volume in Long Beach:

Single family homes - 181 properties
Condos/townhomes, Co-ops, OYOs, Lofts -  79 properties
Units (2-4) -28  properties

September 2011 sales volume in Long Beach:

Single family homes - 188 properties
Condos/townhomes, Co-ops, OYOs, Lofts - 75 properties
Units (2-4) - 36 properties

August 2011 sales volume in Long Beach -

Single family homes - 207 properties
Condos/townhomes, Co-ops, OYOs, Lofts - 97 properties
Units (2-4) - 40 properties

Buyers should understand that there's a lot of opportunity in the area right now--take a look at the MLS inventory vs. the number that have sold:
Currently, there are 141 active listings in the MLS for 2-4 unit properties in Long Beach, ranging from $159,900 in North Long Beach, to $1,499,000 for 4 units in Alamitos Beach (90802).

There are 668 single family homes actively listed in Long Beach from just under $100,000 in North Long Beach to over $9 million in 90803 on Sea Isle in Naples (90803).

There are 444 condos/townhomes, OYOs, Co-ops and Lofts actively listed, the vast majority of which are condominiums, ranging from $47,000 in downtown Long Beach to $1,095,000 in Spinnaker Cove.

Take a look at the properties attached to the links--it's an easy to sift through the market!

Market Prices in Other Cities:

Cerritos has had only a 6.9% drop in single family prices from October, 2010; Diamond Bar has a 25% increase; two zip codes in Downey have an increase;  Duarte, a 40% increase; San Gabriel, a 22% increase; Torrance, 3 zip codes show an increase; all zip codes in Whittier increased up to 26%; Los Alamitos, .8% increase; Garden Grove, two zip codes show increases of 2-3% range.  (See the Los Angeles Times chart for more information.)

With interest rates not seen since the 1940s, it's a great time for low monthly payments!

9/24/2007

Sales Activity Comparisons for Long Beach and Cerritos

The number of houses selling over $1,000,000 in the 90803 zip code now equal about half of total sales of single family homes during July and August. While there are those who say that this fact skews the overall median price, it's still a fact that there is a market in this price range where it did not exist a few short years ago. In August, the AVERAGE sales price of 17 closed escrows, per the MLS, was $1,283,876 at an average of 64 days on market with the selling price about 91% of the original list price. In July, 25 properties closed escrow after an average of 68 days on the market at an average selling price of $1,408,653, at 92% of the original list price. The lower end of sales in this area was around $600,000, and up.

If these prices shock you, just look at the blue-footed doobie for a minute.

The story for July and August of 2006 for 90803 was almost the same for average price and number of sales (18 for both months), but the average time on market was MUCH longer: 124 days on market in July and 97 days on market for the average sale of $1,175,000 in August.

The story in Cerritos is similar: August of 2006 saw 53 days on the market, July was 42 days on market. August of 2007 was 26 days on the market (half the time to sell from one year ago) and July of 2007 the average sale time was 29 days on the market.

For both years the sale to list price percentage is higher than Long Beach--in July of 2006 it was 97% of the original list price and in July of 2007 it was 95% of the original list price. The average sale price has declined in those two months to $715,789 for August and $747,754 for July of 2007.
If you still want to be in Long Beach near the beach, the house at the right is on the market for $689,900 in Belmont Heights. For more information, call me or go to www.juliahuntsman.com and find 261 Grand on the property search engine.

'Voice this!
Web Statistics